Fig. 2.
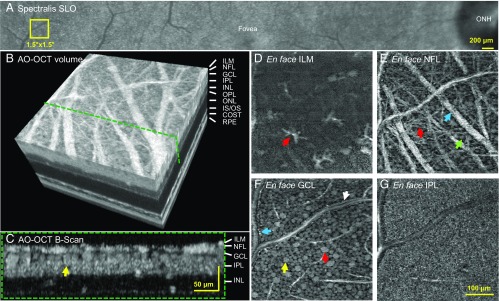
Cellular structures of the inner layers of the retina using AO-OCT. (A) Yellow square at 12–13.5° temporal to the fovea in subject S3 denotes location imaged with AO-OCT. (B) Three-dimensional perspective of registered and averaged AO-OCT volume with green dashed line denoting cross-section of inner retina shown in C. Yellow arrow indicates same GCL soma in C and F. Images shown in D–G were extracted at depths of 0, 13, 22, and 46 μm below ILM. Scale bar in G also applies to D–F. (D) Surface of ILM. Bright, irregular star-like structures sparsely cover the surface of the ILM and are consistent in appearance with individual astrocyte or microglial cells. (E) A complex web of nerve fiber bundles of varying size disperse across the NFL. Some have a diameter as large as 30 μm (blue arrow), which compares to our previous AO-OCT observations (48). Others are as small as 3 μm, which matches the caliper of a single large GC axon. An arteriole/venule branches on the left. GCL somas appear between the overlying bundles near the image bottom (green arrow). (F) A mosaic of GCL somas of varying size tile the layer. Red arrow points to a large soma. Caliper of arteriole/venule in E is sufficiently large that it extends into the GCL. Note the distinct edges of the vessel walls (blue and white arrows) and the tight abutment of GCL somas. (G) The dense synaptic connections between axons of bipolar cells and dendrites of ganglion and amacrine cells present as a uniform mesh of high spatial frequency irregularities in the IPL. COST, cone outer segment tip; IS/OS, inner segment/outer segment junction; ONL, outer nuclear layer; OPL, outer plexiform layer (Movie S1).

