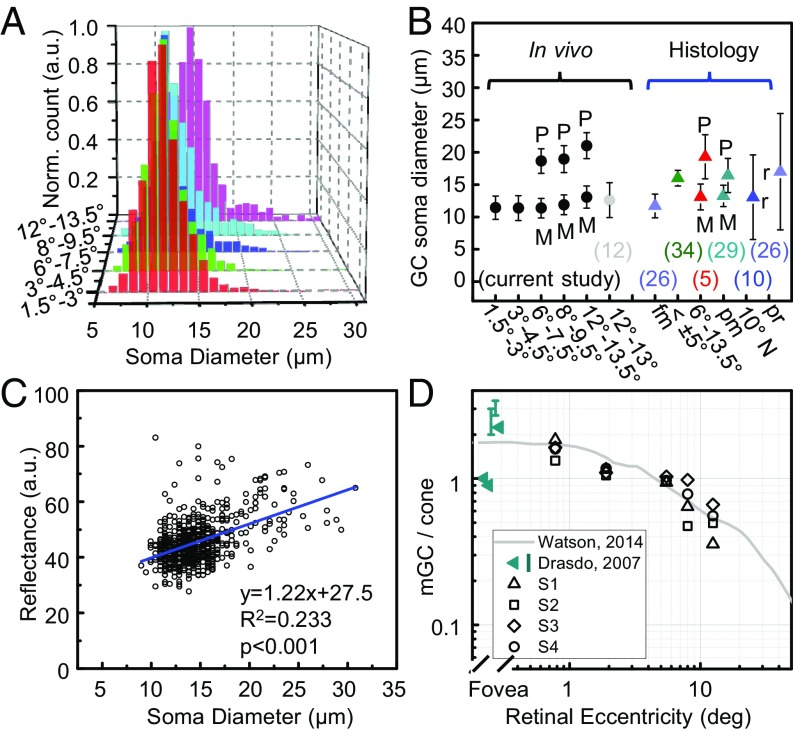
Fig. 4.
Properties of soma size, reflectance, and pooling of cone signals. (A) Representative GCL soma size distribution (S4) is color coded by retinal eccentricity. (B) Average GC soma diameter obtained by Gaussian fits to the four subjects in temporal retina with measurements reported in the literature for humans (5, 10, 12, 26, 29, 34). Error bars denote ±1 SD unless labeled with an r to denote minimum-to-maximum range. M and P denote midget and parasol cells. Labels along x axis report retinal location of measurement. fm, foveal margin; pm, papillomacular; pr, peripheral retina. (C) Representative reflectance of 637 GCL somas at 12–13.5° temporal to the fovea in subject S4. Blue line shows linear regression curve. (D) mRGC-to-cone ratio for four subjects is plotted with Watson’s histology-based model for humans (figure 14 of ref. 21) and fovea ratios in table 1 of Drasdo et al. (20).

