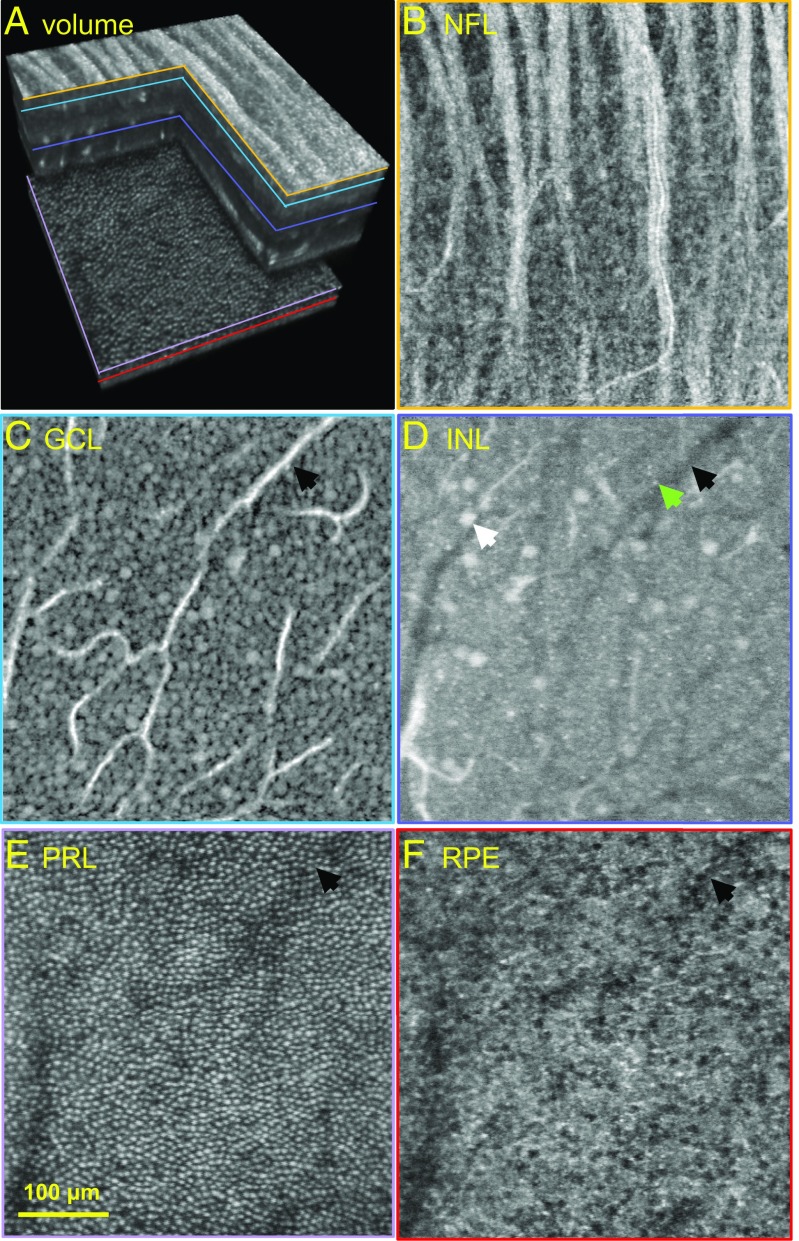
Fig. 5.
Cells at different depths in the same retinal patch of subject S4 as visualized with AO-OCT. (A) Three-dimensional perspective of registered and averaged AO-OCT volume with colored lines denoting retinal depths at which the en face images in B–F were extracted. Images depicting individual NF bundles (B), GCL somas (19,162 cells per mm2) (C), suggestive somas of bipolar (green arrow) and displaced GCs (white arrow) near the IPL interface (D), cone photoreceptors (16,341 cells per mm2) (E), and RPE cells (4,893 cells per mm2) (F). Black arrows in C–F indicate the same blood vessel and its shadow. The en face images were extracted from volumes acquired at 3–4.5° retinal eccentricity with system focus shifted axially to maximize sharpness of the cell layer of interest.

