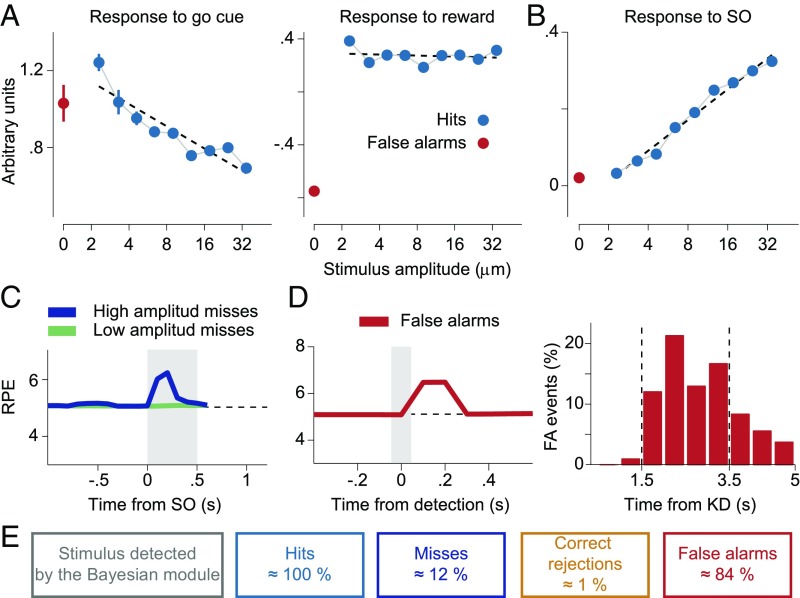
Fig. 6.
Basic properties of the RPE. (A) The RPE at the go cue depended on the stimulus amplitude but this dependence was lost at the reward delivery. (A, Left) In stimulus-present decisions the RPE at the go cue linearly decreased (R2 = 0.84, P < 0.001) with the amplitude of the stimulus. (A, Right) The dependence on the amplitude completely disappeared in the RPE at the reward delivery (R2 = 0.03, P = 0.64) as a consequence of the reset property of the go signal. This should be compared with the DA activity in Fig. 3. (B) Responses at the SO in yes-decision trials as predicted by the model sorted by stimulus amplitude. The model showed a positive linear increase of the response with the amplitude of the stimulus (R2 = 0.98, P < 0.001). See SI Materials and Methods for more details on the model analysis). (C) The model predicted a response to the stimulus as a consequence of a Bayesian detection in miss trials when the amplitude is high. A similar response was apparent in the data Fig. 2B. (D, Left) The RPE in FA trials after an erroneous detection showed a phasic response. (D, Right) In the model these erroneous detection events were produced mainly within the PSW. KD denotes the key down event. (E) Percentage of trials where a transient event was detected by the Bayesian module, for each of the four task contingencies. Note how the occurrence of a detected event in the Bayesian module did not by itself generate perception (miss trials). The values of the model parameters are given in Table S1.

