Fig. 5.
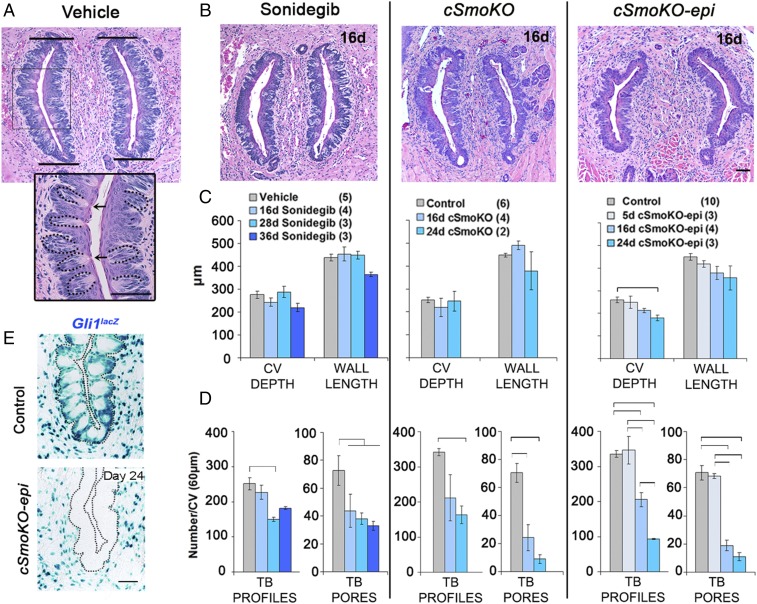
Pharmacologic and genetic HH pathway blockade decreases TB in CV papillae. (A) H&E staining for CV/TB morphology in vehicle-treated mice. Bars delimit the CV walls, for measuring wall length. (Inset) An enlarged image of the boxed region illustrating TB profiles (dotted lines) and TB pores (arrows). (Scale bars: 50 μm.) (B) H&E staining for CV/TB morphology after 16 d of HPI by sonidegib or whole-body (cSmoKO) or epithelial Smo (cSmoKO-epi) deletion. (Scale bar: 50 μm for all images in A and B.) (C and D) Graphs for depth and wall length (C) and TB profiles and TB pores (D). Brackets in D denote significant differences (one-way ANOVA with Tukey’s HSD post hoc tests). Bars are mean ± SEM. F and P values are given in Fig. S4 A and B. (E) X-Gal staining (blue) for Gli1lacZ illustrates HH-responding cells in epithelium and stroma in control and 24-d cSmoKO-epi mice. Dotted lines outline the epithelium. (Scale bar: 50 μm for both images.)

