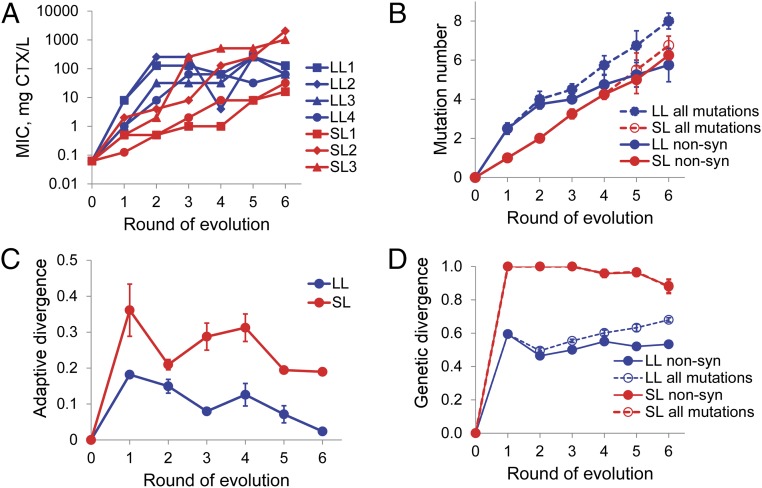
Fig. 2.
Dynamics and repeatability of phenotypic and genomic evolution. (A) Changes in CTX resistance of the four LL (blue) and four SL (red) lines. Shown are the median of three replicate MIC assays per line and round. (B) Average number of mutations in LL (blue) and SL (red) lines for nonsynonymous mutations (solid lines) and all mutations (dashed lines). (C) Relative phenotypic divergence, measured as the average pairwise difference in MIC-step improvement relative to TEM-1, divided by the sum of MIC-step improvements of both lines. (D) Relative genetic divergence, considering only nonsynonymous or all mutations, measured as the pairwise Hamming distance divided by the sum of both Hamming distances relative to TEM-1. Error bars are SEM based on variation among the four replicates.

