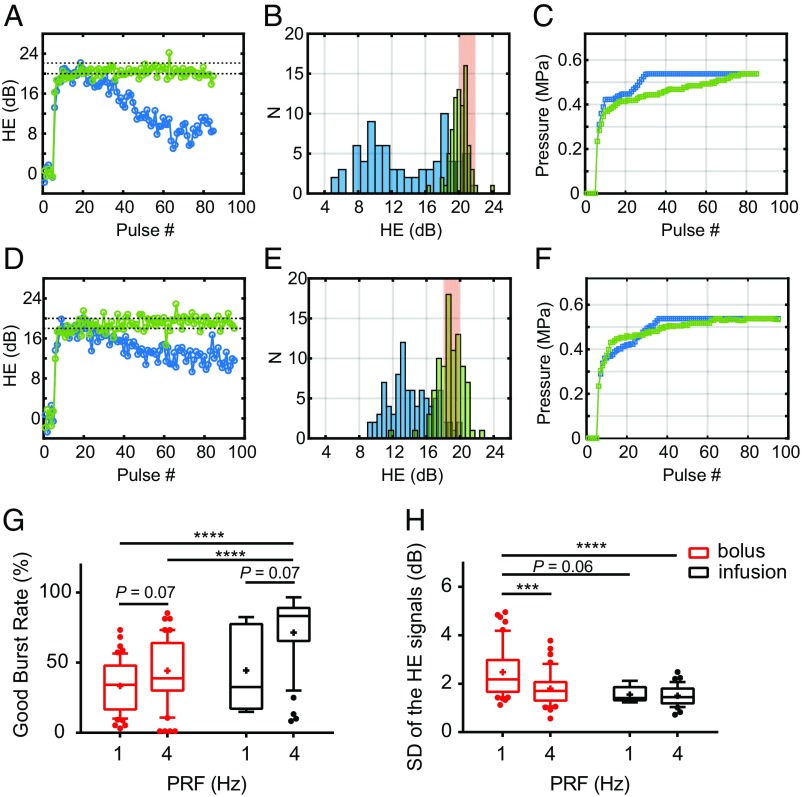
Fig. 3.
Optimizing the acoustic performance of the closed-loop controller. (A) Representative HE profiles for two sonications of the same target with 1-Hz (in blue) versus 4-Hz (in green) PRF. The desired HE range was shown as black dashed lines. (B) Histograms of the two HE profiles shown in A. (C) Sonication input (acoustic pressure) profiles for the two examples shown in A. (D) Representative HE profiles for two sonications of the same target using 4-Hz PRF with bolus (in blue) versus infusion (in green) administration of Optison microbubbles. (E) Histograms of the two HE profiles shown in D. (F) Sonication input profiles for the two examples shown in D. (G and H) Statistical comparisons for all of the 1- and 4-Hz PRF sonications for both bolus and infusion administrations (1 Hz + bolus, n = 55; 4 Hz + bolus, n = 53; 1 Hz + infusion, n = 6; 4 Hz + infusion, n = 36). (G) Statistical comparison of the good burst rate (GBR), which measured the percentage of pulses where HE was in the desired range. ANOVA showed statistical significance for both factors, PRF (P = 0.001) and microbubble administration mode (P = 0.001). Multicomparison tests suggested 4-Hz PRF using infusion injection significantly improved the GBR compared with the bolus injection groups. (H) HE stability comparison assessed by the SD of the HE signals. ANOVA showed significance for PRF (P = 0.003) but not bubble administration mode (P = 0.07). Multicomparison tests suggested that 4 Hz with microbubble infusion was superior in sustaining HE stability to 1 Hz with bolus injection. (Box limits, 25 and 75 percentiles; whiskers, 5 and 95 percentiles; center line, median; +, mean. Statistical significance was assessed via two-way ANOVA with a Tukey multicomparison test; ***P < 0.001; ****P < 0.0001.)

