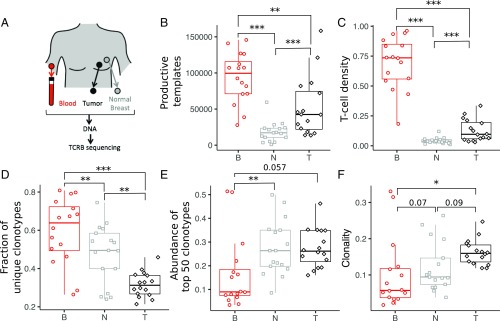
Fig. 1.
T cell abundance and repertoire diversity in blood, tumor, and adjacent normal breast tissue. (A) Matched trio of samples was obtained from blood PBMCs, tumor, and normal breast tissue for each patient. Genomic DNA was isolated from each sample, and the TCRB region was PCR-amplified before Illumina sequencing. The set of unique clonotypes, defined as TCRB sequences with the same V family, J gene, and CDR3 amino acid sequence, and the number of input template molecules for each clonotype comprise the TCRB repertoire in each sample. The number of T cells in each tissue is estimated from the abundance of in-frame TCRB template molecules (B), and the number density is determined as the fraction of templates relative to the number of input cells (C) (SI Appendix, Table S1). Repertoire diversity for each tissue is estimated from the fraction of templates corresponding to unique clonotypes (D), the cumulative abundance of the top 50 clonotypes in each sample (E), and the clonality (F). Additional details are provided in Materials and Methods. Unless otherwise indicated, *P < 0.05; **P < 0.005; ***P < 0.0005. B, blood; N, normal breast; T, tumor.

