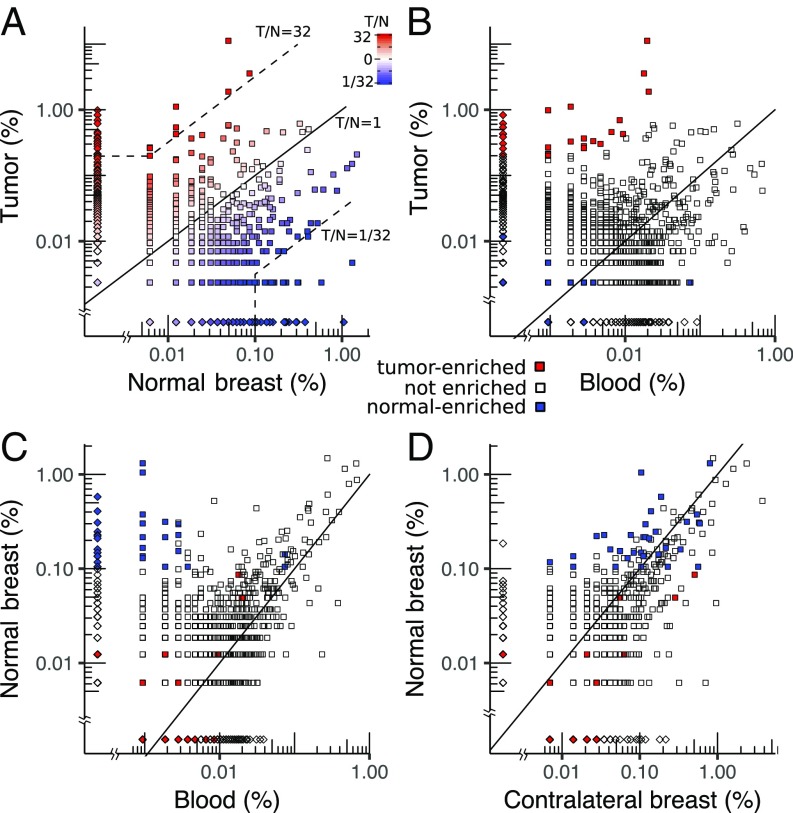
Fig. 3.
Scatter plots of clonotype abundance for patient BR21. (A) Tumor (T) vs. normal breast (N). (B) Tumor vs. blood. (C) Normal breast vs. blood. (D) Normal breast vs. contralateral normal breast. Each point represents a clonotype detected in one (diamonds) or both (squares) samples. Clonotypes with equal abundance in both samples lie along the diagonal (solid black line), whereas clones enriched in the tumor relative to normal breast or normal relative to tumor are defined as relative abundance greater than 32 and absolute abundance greater than 0.1% (dashed lines). Note that many sequences, especially at low abundance, contain the same number of templates in both samples but are only represented by a single point (the distribution of clonotype abundances is shown in SI Appendix, Fig. S7).

