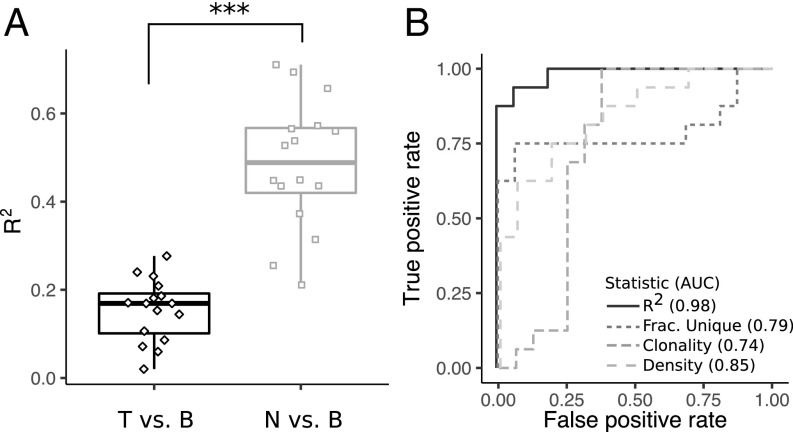
Fig. 4.
Distinguishing between TCRB repertoires from tumor and normal breast. (A) R2 resulting from fitting the tumor vs. blood abundance and normal breast vs. blood abundance (fit lines are shown in SI Appendix, Figs. S10 and S11). ***P < 0.0005. (B) Receiver operator curves and corresponding AUC values for metrics that distinguish repertoires between tumor and normal breast. B, blood; Frac., fraction; N, normal breast; T, tumor.

