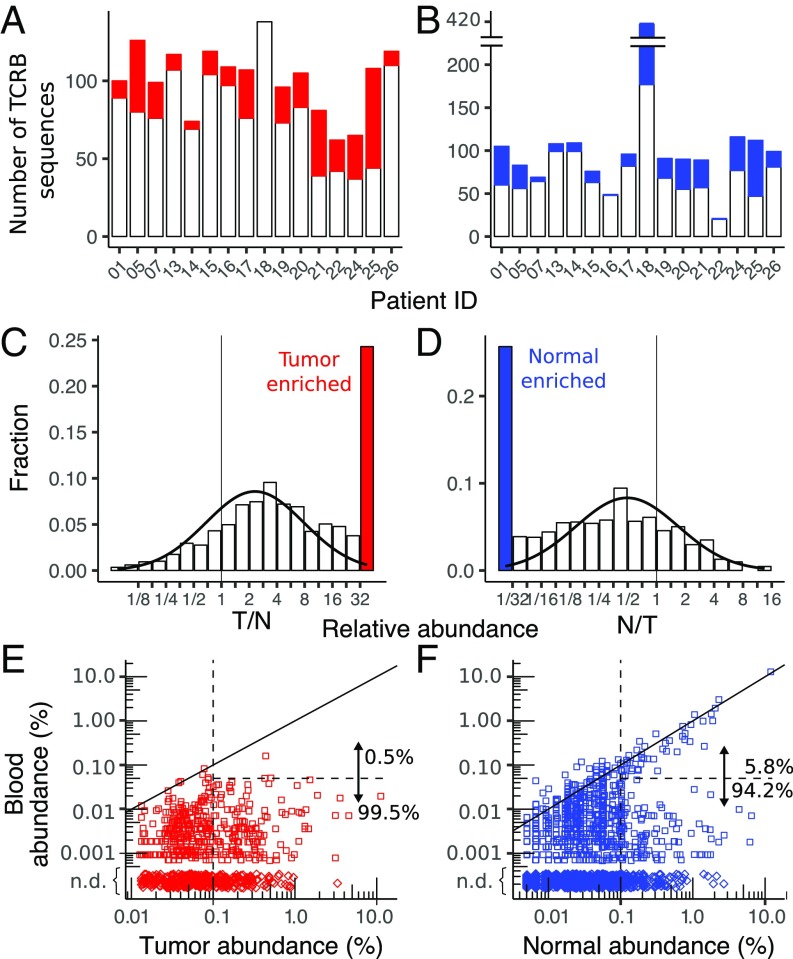
Fig. 5.
Enriched sequences in tumor and normal breast. The total number of sequences with abundance greater than 0.1% in each patient, including the number that are enriched in the tumor relative to normal breast (A) and in the normal breast relative to tumor (B), is shown The relatively large number of enriched sequences in normal breast from BR18 is likely due to the low-input amount of normal breast DNA in this sample (SI Appendix, Table S1), which can be seen in the small number of low-abundance (<0.1%) sequences (SI Appendix, Fig. S12). The distribution of enriched sequences across all patients for sequences in the tumor (C) and normal breast (D, not including the outlier BR18), including a curve fit to a log normal distribution (solid black line), is shown. N, normal breast; T, tumor. Scatter plots compare the enriched clonotypes in tumor (E) and normal breast (F) with their abundance in peripheral blood. Both high- and low-abundance (0.1%, vertical dashed line) clonotypes are shown, and the fractions of sequences that are highly correlated with blood (solid diagonal line) and with abundance greater than 0.05% (horizontal dashed line) are enumerated. Clonotypes detected in tumor or normal breast but not detected (n.d.) in blood (♢) are depicted with arbitrary tissue abundance.

