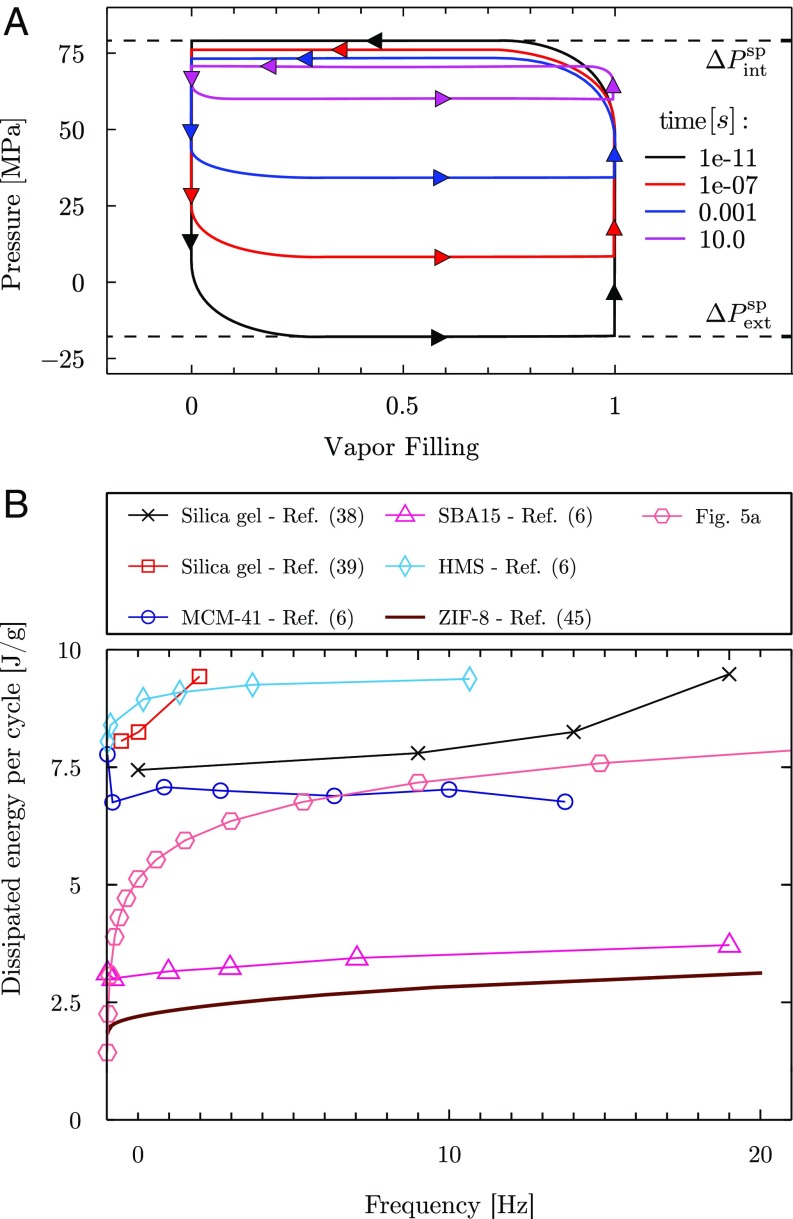
Fig. 5.
(A) Hysteresis cycle for a thought intrusion/extrusion experiment on the -nm pore; the pressure is varied between the intrusion value and the extrusion one, (black lines). The plot is constructed by adding a term to the atomistic free-energy profile at in Fig. 4 and by computing the spinodal pressures; the compressibility of the liquid and of the pore walls is not taken into account, resulting in a rectangular cycle (only the values of the pressure at the plateaus are actually computed; rounded angles help visualization). On the axis, the bubble volume is normalized with the maximum value such that it ranges from (fully wet pore) to (vapor bubble occupying the nanopore). The pressures at which intrusion (top plateau) and extrusion (lower plateau) happen for fixed experimental times are computed inverting Eq. 1 to obtain the intrusion and extrusion barriers corresponding to the prescribed (colored lines). (B) Energy dissipated per cycle as a function of the frequency, from refs. 6, 38, 39, and 45 and from A. Experimental data, which are available over a limited range of frequencies, were originally given in different units, which required estimates of the porosity (38, 39) or interpolation of and (45). We remark that experiments are performed on different materials, temperatures, and, for some of them (38), refers to the entire device.

