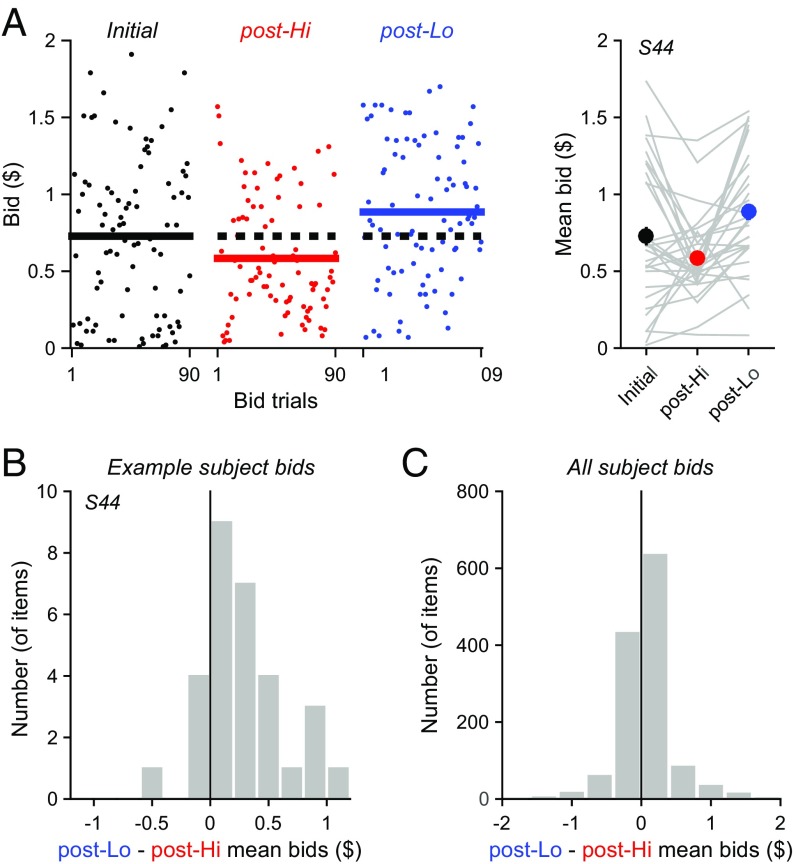
Fig. 2.
Postadaptation bids depend on value history. (A) Example of observed bids across time. (Left) Individual bids in three Test blocks (black, initial block; red, post-Hi block; blue, post-Lo block). Solid lines show the average bid across all items in each Test block; for comparison, dotted black line denotes average bid in the initial test block. (Right) Mean bids by block (error bars, SEM). Gray lines connect mean bids for an individual item across blocks. (B) Example distribution of bid differences, calculated for each snack food item as the difference between mean bids in the post-Lo and post-Hi Test blocks. As evident in the shifted distribution, bid differences were positive in this example subject, indicating significantly higher bids in post-Lo versus post-Hi blocks (P = 5.46 × 10⁻⁵, paired t test). (C) Distribution of population bid differences. Across all items in all subjects, post-Lo bids significantly exceeded post-Hi bids (P = 6.55 × 10⁻⁶, paired t test).

