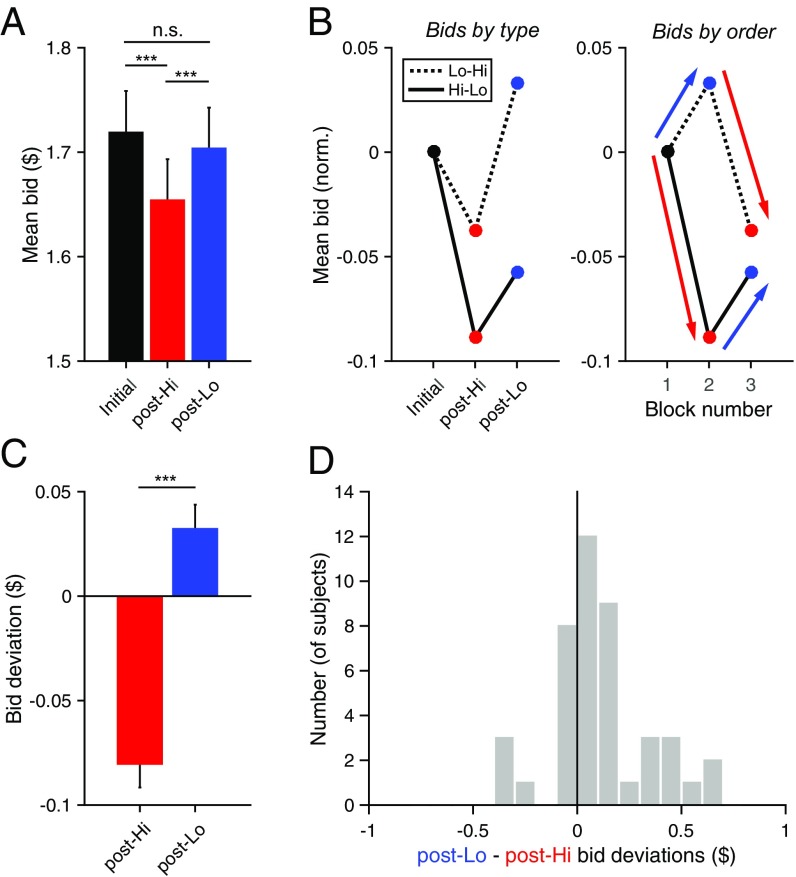
Fig. 3.
Bid deviations quantify effect of adaptation. (A) Mean bids by Test block condition (***P < 0.001). (B) Mean normalized bids segregated by adaptation sequence. To facilitate comparison, bids are normalized by subtracting mean initial Test block bid value. Solid and dashed lines show data from subjects presented with Hi-Lo and Lo-Hi adaptation sequences, respectively. (Left) Data as a function of Test block condition. (Right) Data as a function of sequential block number. As shown by the arrows, bid changes relative to previous bids were similar following Lo-value (blue) and Hi-value (red) adaptation. (C) Mean bid deviations across all subjects. For each bid, bid deviation was calculated as the difference between the bid and the average bid for that item in the previous Test block (error bars, SEM). Post-Hi deviations are significantly negative (P = 1.91 × 10⁻¹², t test), and post-Lo deviations are significantly positive (P = 5.4 × 10⁻³, t test). (D) Distribution of subject bid deviation differences. Across subjects, post-Lo deviations significantly exceed post-Hi deviations (P = 3.3 × 10⁻³, paired t test).

