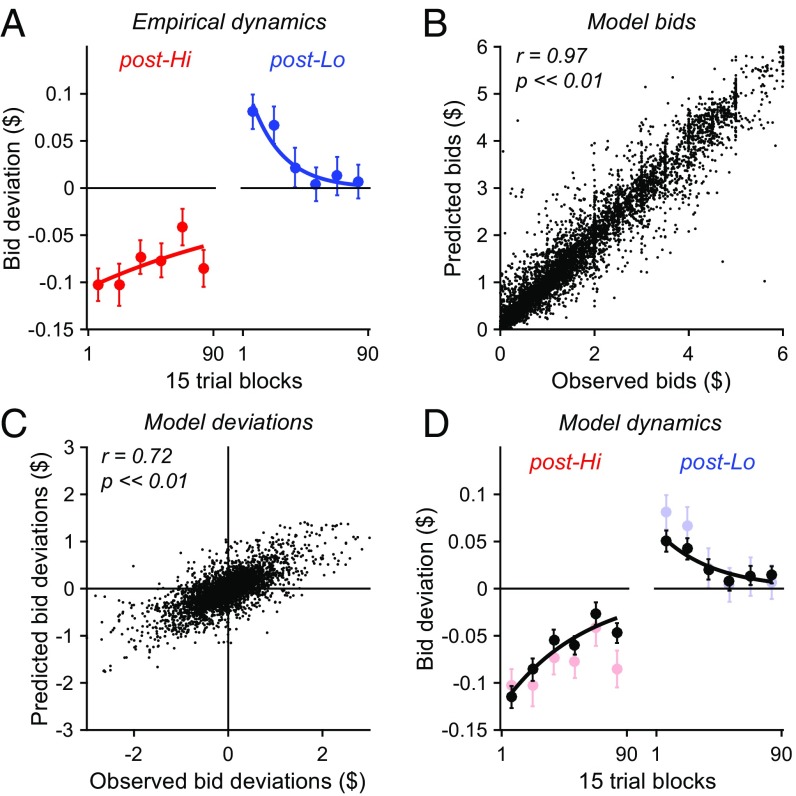
Fig. 4.
Bid deviation dynamics are explained by a value normalization model. (A) Bid deviation dynamics. Points plot average bid deviations in successive 15 trial windows across post-Hi (red) and post-Lo (blue) blocks (error bars, SEM). Lines plot exponential curves fit to the deviation dynamics. (B) Normalization model bids. Data points show predicted versus observed bids for all postadaptation Test trials. Model-predicted bids are significantly correlated with observed bids (r = 0.97, P << 0.01). (C) Normalization model bid deviations. Data points show predicted versus observed bid deviations. Model-predicted bid deviations are significantly correlated with observed bid deviations (r = 0.72, P << 0.01). (D) Normalization model bid dynamics. Black, model-predicted bid deviations. Data plotted as in A, with observed bid deviations for comparison.

