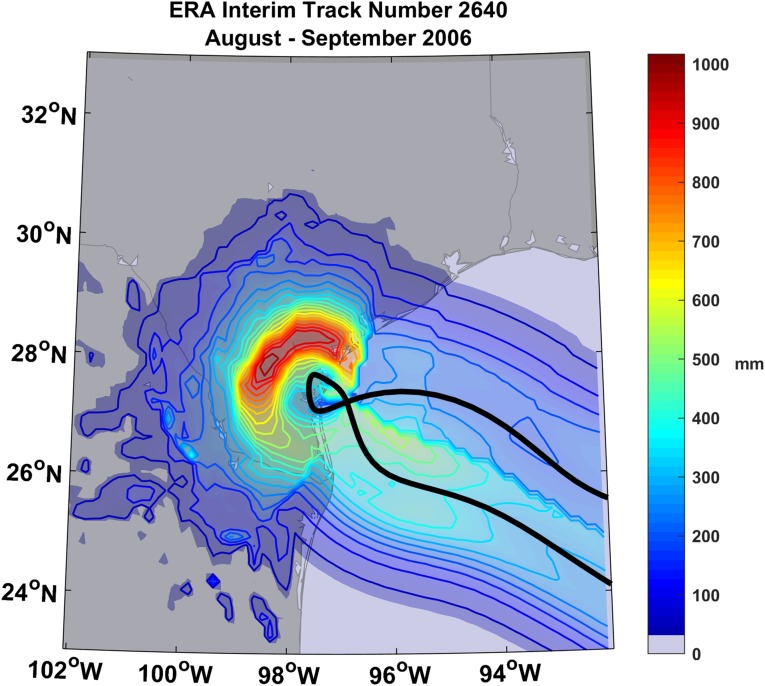
Fig. 1.
Storm total rainfall (millimeters) from a simulated tropical cyclone driven by climate analysis data over the period 1980–2016. This simulated event took place in August and September 2006. The track of the storm center is indicated by the back curve; it approached Texas from the southeast, moved slowly around a counterclockwise path in coastal Texas, and exited toward the southeast.

