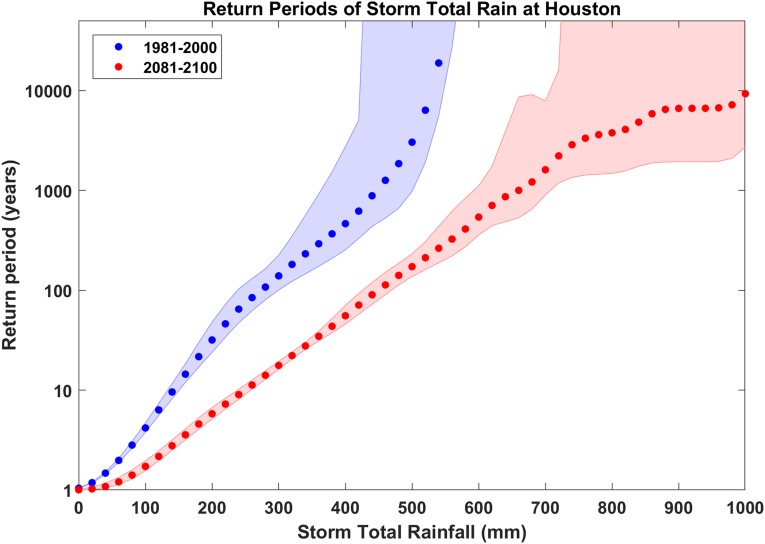
Fig. 4.
Return periods of hurricane total rainfall (millimeters) at the single point of Houston, Texas, based on 3,700 simulated events each from six global climate models over the period 1981–2000 from historical simulations (blue), and 2081–2100 from RCP 8.5 simulations (red). The dots show the six-climate-set mean and the shading shows 1 SD in storm frequency, remapped into return periods.

