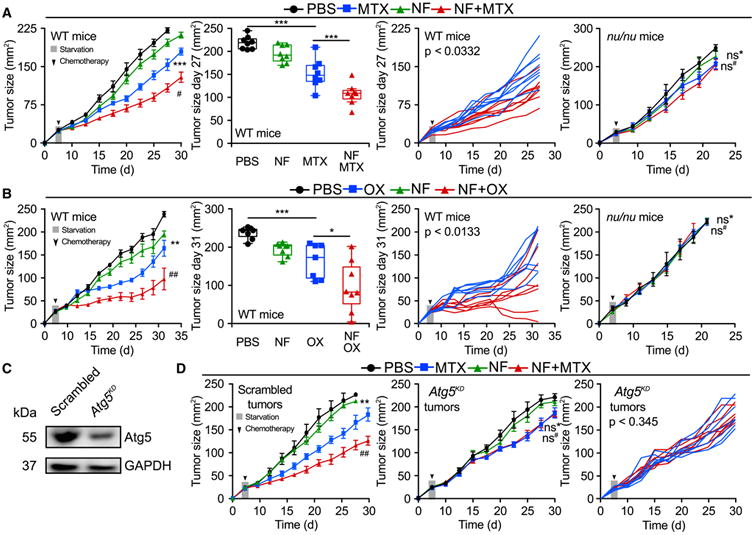
Figure 1. Fasting Improves the Efficacy of Chemotherapy in an Immune System- and Autophagy-Dependent Fashion.

(A and B) Immune system-dependent effects of starvation. Wild-type (WT) immunocompetent C57BL/6 and athymic mice (nu/nu) mice were inoculated subcutaneously with murine fibrosarcoma MCA205 cells. When tumors became palpable, mice were fed ad libitum or underwent 48 hr fasting (NF, nutrient free) and received intraperitoneal chemotherapy with mitoxantrone (MTX) (A) or oxaliplatin (OX) (B), or an equivalent volume of PBS (PBS). From left to right: (1) average (±SEM) tumor growth curves of WT mice subjected to 48 hr starvation alone or in combination with MTX or OX from one representative experiment of two with at least seven mice per group; (2) tumor size distribution at day 27 (MTX) or day 31 (OX) of data shown in (1); (3) individual growth curves from mice treated with MTX or OX alone or combined with fasting of data shown in (1); (4) averaged (±SEM) tumor growth curves from immunodeficient nu/nu mice subjected to 48 hr starvation alone or in combination with MTX or OX from one representative experiment of two with at least five mice per group. For nu/nu mice, PBS and MTX groups are shared with experiments depicted in Figures 4B–4D.
(C and D) Autophagy deficiency impairs starvation-mediated improvement in anthracycline-based therapy. (C) Immunoblot showing effective knockdown of Atg5 in murine MCA205 fibrosarcoma cells. (D) WT immunocompetent C57BL/6 mice were inoculated subcutaneously with autophagy-competent control cells expressing a scrambled control shRNA (left panel) or Atg5KD MCA205 cells (middle and right panels). When tumor became palpable, they were treated as in (A). Data are shown as averaged (±SEM) tumor growth curves of at least five mice per group from one representative experiment of two (left/middle panels) or as individual curves from mice treated with MTX alone or combined with fasting (right panel). Statistical analysis was performed by linear mixed-effect modeling (over the whole time course) and linear modeling (at a single time point). ***p < 0.001, **p < 0.01, *p < 0.05 (PBS versus MTX or OX); ##p < 0.01, #p < 0.05 (MTX versus MTX + NF or OX versus NF + OX); ns, not significant. For a comprehensive account of all comparisons, see also Tables S1 and S2.
