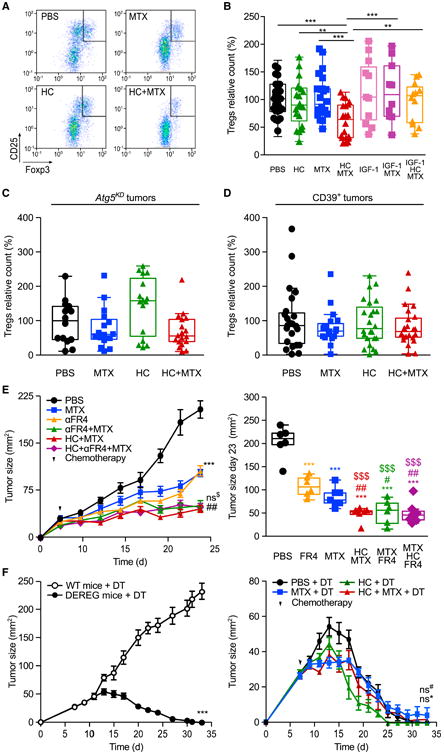
Figure 6. Autophagy and ATP-Dependent Depletion of Intratumoral Tregs by Hydroxycitrate.

(A) Representative fluorescence-activated cell sorting profiles and quantification of CD4+CD25+Foxp3+ cells in the tumor infiltrate from cancers treated with mitoxantrone (MTX) and/or hydroxycitrate (HC) 11 days post chemotherapy.
(B) Effects of MTX, HC, and insulin growth factor 1 (IGF-1) on the frequency of tumor-infiltrating CD4+CD25+Foxp3+ cells.
(C and D) Effects of MTX and HC on the frequency of CD4+CD25+Foxp3+ Tregs infiltrating autophagy-deficient Atg5KD (C) or CD39-overexpressing (D) tumors. In (B–D), data are relative to the control (PBS) group of each experiment each dot represents a distinct tumor.
(E and F) Regulatory T cell (Treg) depletion and HC administration similarly improve the effect of MTX. (E) Wild-type (WT) immunocompetent C57BL/6 mice were inoculated subcutaneously with MCA205 cells. When the tumor became palpable, mice received MTX, 100 mg/kg intraperitoneal HC, and/or anti-FR4 antibody. Averaged (±SEM, one experiment involving six mice per group) tumor sizes are reported for the entire duration of the experiment (left panel) together with the tumor size distributions at day 23 (right panel). (F) C57BL/6-Tg (Foxp3-DTR/EGFP) DEREG (DEpletion of REGulatory T cells) transgenic mice and their WT lit-termates were inoculated subcutaneously with MCA205 cells. When tumors became palpable, mice were injected intraperitoneally daily with 1 μg/kg diphtheria toxin (DT) for 15 days. DEREG mice were administered with HC in drinking water. At day 2 post DT and HC administration, DEREG mice received chemotherapy with MTX or PBS. Results are shown as means ± SEM (at least eight mice per group).
Data were analyzed by ANOVA for multiple comparisons (B–D), linear mixed-effect modeling (E, left panel, and F), and linear modeling (E, right panel). Levels of significance: ***p < 0.001, **p < 0.01, *p < 0.05 (comparisons with PBS); ##p < 0.01, (comparisons between MTX and MTX combinations); $$$p < 0.001 (comparisons with anti-FR4 antibody); ns, not significant. For all comparisons in (B–F), see Tables S1 and S2. For additional evidence for the involvement of extracellular ATP metabolism and Treg depletion in the anticancer effects of HC, see Figure S6.
