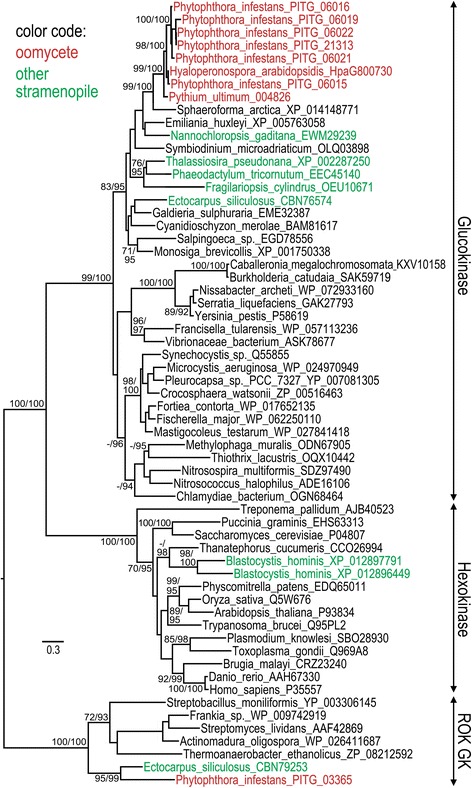
Fig. 3.

Phylogenetic analysis of glucokinases and hexokinases. Trees were generated using PhyML as described in Methods. Numbers at nodes represent bootstrap values above 70% from PhyML, and posterior probability (PP) values above 90 from mrBayes. Oomycetes are shown in red and other stramenopiles in green. Each sequence is marked with its GenBank accession number, except for oomycete proteins which use gene numbers assigned by their respective genome projects. Whether the proteins match pfam domains for glucokinase, hexokinase, or ROK glucokinases is indicated in the right margin
