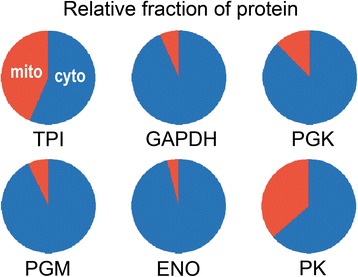
Fig. 5.

Fraction of protein with cytosolic versus mitochondrial localization. Values are based on LC-MS/MS and approximated using the emPAI method as described in Methods. TPI and GAPDH values include the TPI-GAPDH fusion protein. Mitochondrial and cytoplasmic forms are represented by red and blue, respectively
