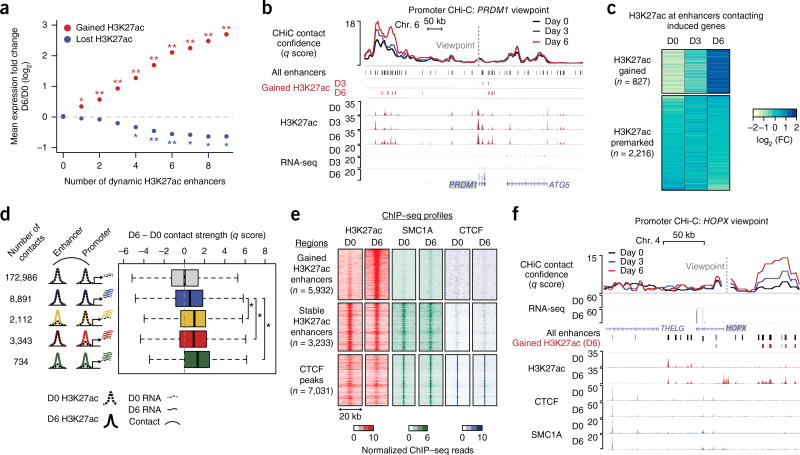
Figure 2.
Enhancer activation and contact dynamics are linked independently of cohesin. (a) Mean change in expression for genes in CHi-C contacts with enhancers displaying gained or lost H3K27ac status (empirical FDR, *, FDR < 0.05; **, FDR < 0.01). (b) Genomic locus of the PRDM1 gene, including CHi-C q score and H3K27ac ChIP–seq signal tracks. Gained enhancers correspond to H3K27ac peaks with significant gain in H3K27ac signal on day 3 or day 6 versus day 0 (edgeR, FDR < 0.05; fold change > 2). (c) Heat map of the fold change in H3K27ac ChIP–seq read count. Regions are separated into the set with gained H3K27ac signal on day 6 versus day 0 (edgeR, FDR < 0.05; fold change > 2) and the set with premarked H3K27ac on day 6 versus day 0 (edgeR, FDR > 0.7). (d) Box-and-whisker plots of the difference in contact q score between day 6 and day 0. Contact sets are defined by H3K27ac dynamics at the promoter locus (bait HindIII fragment) or enhancer. Dashed lines denote day 0 for either H3K27ac signal or mRNA expression of differentiation-related genes; solid lines denote corresponding signals for day 6. Each box represents the median and interquartile range; whiskers extend to 1.5 times the interquartile range (empirical FDR, *, FDR < 0.01). (e) Heat maps of H3K27ac, SMC1A, and CTCF ChIP–seq signals at gained enhancers, stable enhancers, and CTCF peaks (stable enhancers and CTCF peaks were restricted to chromosome 1 to approximately match the number of gained enhancer peaks). (f) HOPX locus, including CHi-C q score and ChIP–seq tracks for H3K27ac, CTCF, and SMC1A.

