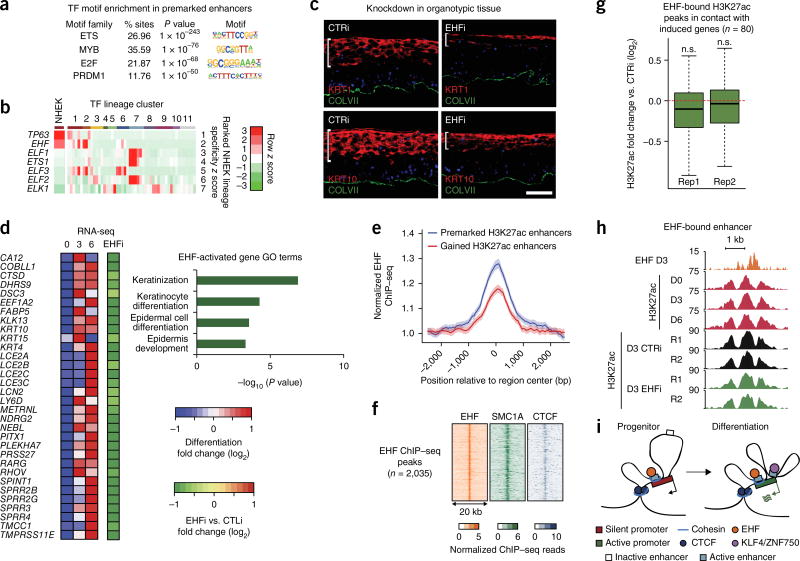
Figure 4.
The transcription factor EHF associates with premarked H3K27ac elements and is essential for epidermal differentiation. (a) Top enriched transcription factor motifs identified by HOMER in premarked H3K27ac elements in contact with the promoters of differentiation-induced genes. (b) Heat map representing z scores of transcription factor expression values determined by RNA-seq from the Roadmap Epigenomics Project. Each cell corresponds to the average expression z score across the cell type groups identified through hierarchical clustering of all genes. Rows are sorted by the z score in the cluster containing epidermal keratinocytes, and the z scores for epidermal keratinocytes are shown separately in the leftmost column. Cluster IDs are as follows: 1, epithelial; 2, cancer cell line; 3, simple epithelial; 4, extramedullary hematopoietic; 5, muscle; 6, gastrointestinal/hepatic; 7, immune; 8, neural; 9, mesenchymal; 10, embryonic; 11, other. (c) Immunofluorescence microscopy of organotypic epidermis treated with siRNAs targeting EHF (EHFi) or a scrambled control. The white bar highlights the height of the region marked by the differentiation-specific proteins KRT1 and KRT10. Scale bar, 50 µm. (d) Heat map representing mRNA expression of differentiation-induced genes in EHF-depleted organotypic epidermis relative to normal control. GO terms were derived for EHF-dependent genes. (e) EHF ChIP–seq metaplot signal at H3K27-premarked (n = 5,932) and H3K27ac-gained (n = 3,233) putative enhancers. Error bands represent 98% boostrapped confidence intervals. (f) Heat maps of day 3 EHF, SMC1A, and CTCF ChIP–seq profiles at all EHF ChIP–seq peaks. (g) Box-and-whisker plots representing relative H3K27ac ChIP–seq signal at day 3 of differentiation in control versus EHF-knockdown conditions. Each distribution represents a biological replicate. Regions analyzed are H3K27ac peaks bound by EHF and in contact with the promoters of differentiation-induced genes. Each box represents the median and interquartile range; whiskers extend to 1.5 times the interquartile range (empirical FDR, n.s., FDR > 0.05). (h) Representative genomic locus demonstrating the effect of EHF depletion at EHF-bound enhancers. (i) Working model. Induction of differentiation-related genes involves two types of enhancer–promoter interactions that occur within CTCF- and cohesin-bound domains: (i) H3K27ac premarked enhancers, bound by cohesin and by constitutively expressed transcription factors, such as EHF, in stable contact with differentiation-related genes and (ii) enhancers that bind inducible transcription factors, such as KLF4 and ZNF750, to gain H3K27ac marks and increase contact with differentiation-related genes.

