
Figure 1.
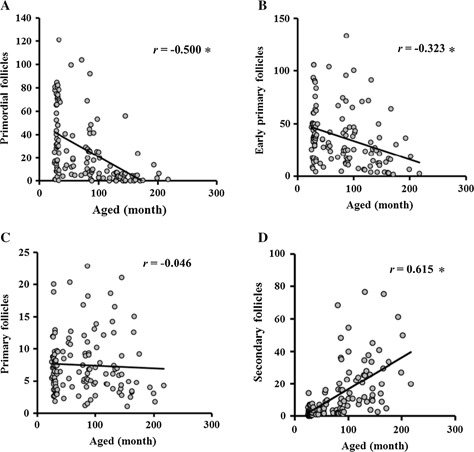
Relationship between donor age and relative number of follicles. The x axis shows donor age in months, and y axis shows the relative number of primordial (a), early primary (b), primary (c) and secondary follicles (d). * P < 0.01. The number of follicles was counted in randomly selected areas under the same microscope, and the average value was multiplied by (the ovary weight)2/3. These figures are modified from Itami et al. 2015 (Japanese Journal of Embryo Transfer 2016 Vol. 37)