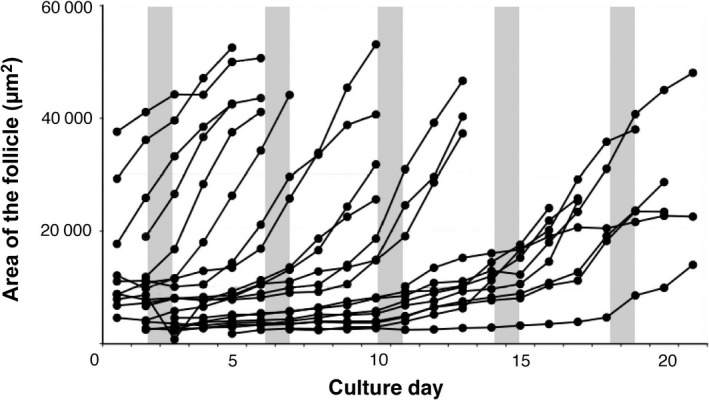
Figure 3.

Changes in the follicular area in the cultured ovarian tissue, which was measured in time‐lapse images at 24 hours intervals. The gray lines indicates the period of luteinizing hormone (LH) surges. This graph presents the follicular area measurements from one ovarian tissue slice
