Figure 1.
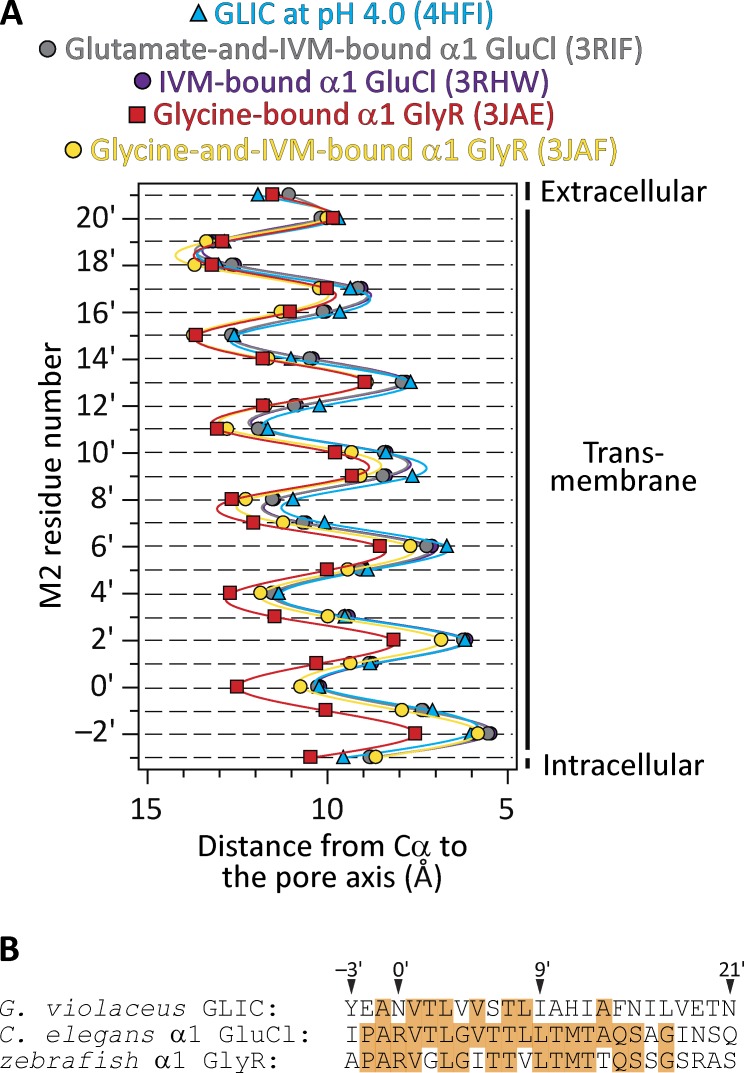
Different open-channel models. (A) Distances between the axis of ion permeation and the Cα atoms for residues in the pore-lining M2 α-helices of five different structural models of pLGICs (mean ± SE of all subunits; error bars smaller than the symbols were omitted). IVM, ivermectin. Solid lines are cubic-spline interpolations. The two GluCl profiles are nearly indistinguishable from each other. A comparison of pore dimensions including the side chains (as could be obtained using HOLE [Smart et al., 1996], for example) seems unwarranted here because the different models correspond to members of the superfamily with different amino acid sequences. The lumen of the pore is to the right of the plot. (B) Alignment of M2 α-helix sequences of the three pLGICs compared in A. Identical residues are indicated with an orange background.

