Figure 6.
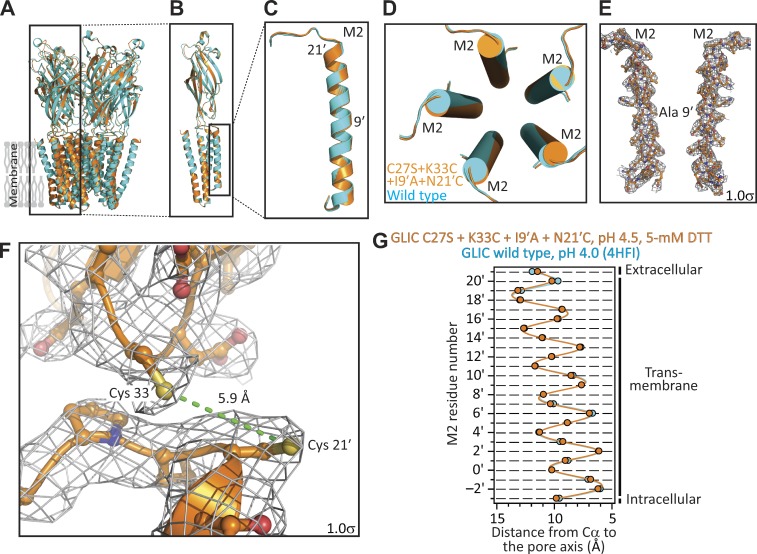
X-ray crystal structure of GLIC C27S + K33C + I9′A + N21′C, in the presence of 5 mM DTT, at pH 4.5. (A–D) Structural alignment of the models of GLIC C27S + K33C + I9′A + N21′C, in the presence of 5 mM DTT, at pH 4.5 (orange) and GLIC WT at pH 4.0 (PDB ID code 4HFI; cyan). (E) M2 α-helices of two nonadjacent subunits of the quadruple mutant. The approximate location of position 9′ is indicated. (F) Magnified view of the cysteines engineered at positions 33 (in the β1–β2 loop of the extracellular domain) and 21′ (at the extracellular end of M2). The ∼5.9-Å distance between the two side-chain sulfur atoms (in yellow) is consistent with the cysteines being reduced. In E and F, mesh representations show the 2Fo − Fc electron-density maps contoured at a level of 1.0σ. (G) Cα profiles of the two structural models compared in A–D. The five subunits of each model were averaged. Error bars (omitted if smaller than the symbols) are standard errors. Solid lines are cubic-spline interpolations. The lumen of the pore is to the right of the plot.

