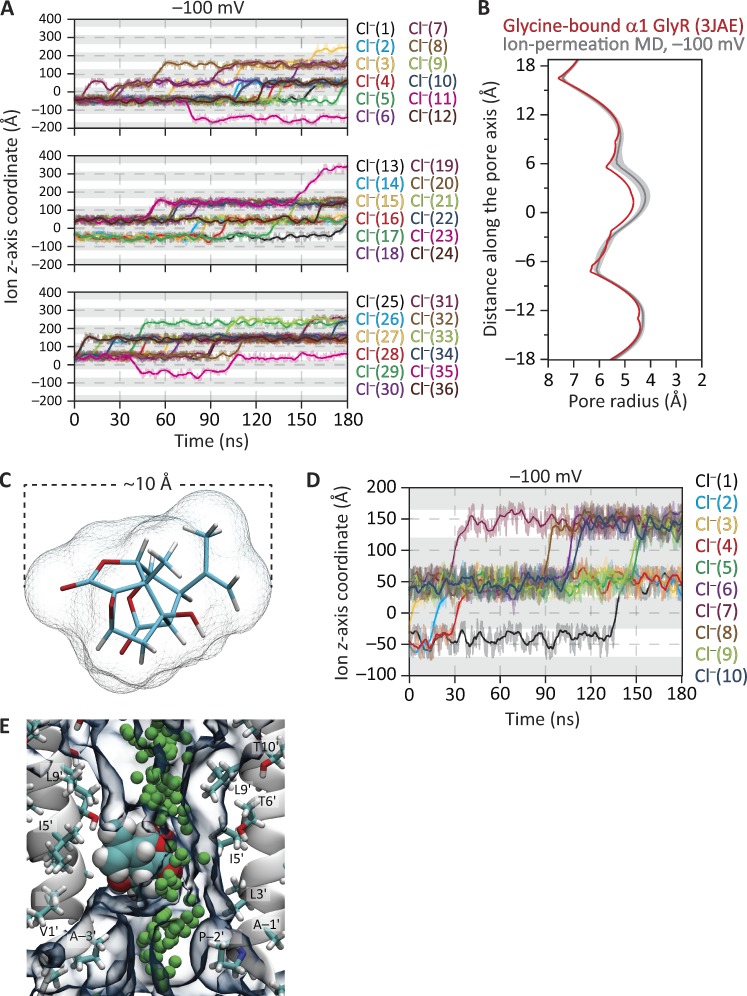
Figure 9.
MD simulations of ion permeation and block through the structural model of the glycine-bound α1 GlyR. The membrane was bathed by symmetrical 150 mM NaCl, and the temperature was 37°C. (A) Ion trajectories at −100 mV. For clarity of display, the trajectories of the 36 Cl– that crossed the membrane at least once in the simulated 180 ns were displayed in three separate panels. (B) Pore-radius profiles (estimated using HOLE [Smart et al., 1996]) of structural models of the glycine-bound GlyR. The profile of the cryo-EM-structure model (PDB ID code 3JAE) is compared with that computed during the ion-permeation MD simulation illustrated in A. The latter is the mean profile—displayed as the mean (darker lines) ± 1 SD (lighter shade)—calculated from the different frames of the simulation; the vertical axis extends, approximately, between M2 positions −3′ (bottom) and 21′ (top). Side-chain rotamers were optimized using SCWRL4 (Krivov et al., 2009) before the ion-permeation simulation was run. (C) Stick representation of the molecule of picrotoxinin (C15H16O6); carbon atoms are cyan, oxygens are red, and hydrogens are white. The mesh representation shows the solvent-accessible surface of the toxin calculated using a 1.5-Å probe radius and with van der Waals radii taken from HOLE (Smart et al., 1996) parameter file simple.rad. (D) Ion trajectories at −100 mV computed for the glycine-bound GlyR model with a molecule of picrotoxinin placed in the pore. In A and D, only the trajectories of ions that crossed the membrane are plotted. In these plots, gray areas indicate the regions occupied by the membrane in the periodic-simulation system, and upward transitions of the ion trajectories through these regions represent outward crossings. The darker lines are running averages of the data, which are displayed in a lighter shade. The length of the simulation box along the z-axis was 95.5 Å. (E) Snapshot from the ion-permeation MD simulation of the 3JAE model at −100 mV with a molecule of picrotoxinin placed in the pore. The permeation trajectory of a Cl– ion is shown as green spheres. The molecule of picrotoxinin is shown in van der Waals representation, and the 30% water-occupancy isosurface is shown as transparent shapes. For clarity, only two nonadjacent chains are shown.

