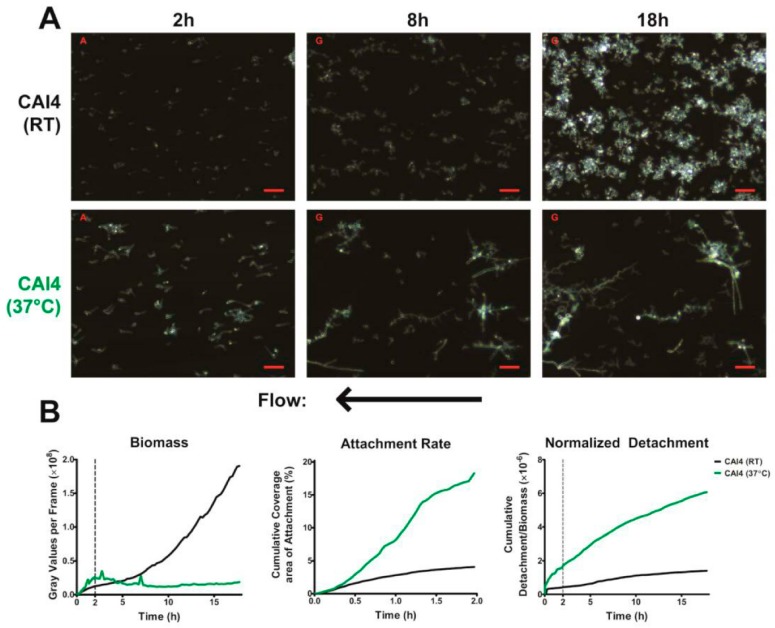
Figure 2.
Biofilm Formation under Flow: (A) Representative darkfield images of biofilm formation under flow are shown for wild-type cells at room temperature (top, black) and 37 °C (middle, green) at 2, 8 and 18 h of growth. Scale bars indicate 50 µm. Arrow indicates direction of media flow for every image; (B) The total biomass within the imaging region (determined by densitometry analysis), the rate of cell attachment, and the detachment rate normalized to the biomass over time are shown. Data are means of n ≥3 experiments.

