Figure 3.
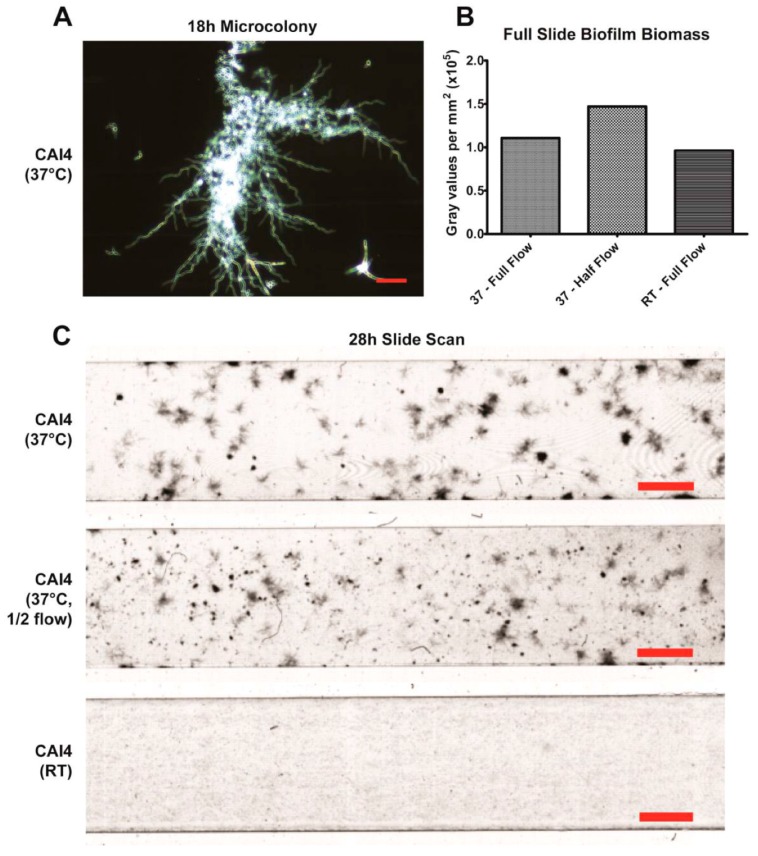
Formation of Microcolonies under Flow at 37 °C: (A) Representative image of a microcolony from a single hyphae, showing extensive hyphal branching, is shown (top left, scale bar indicates 50 µm); (B) Biomass comparisons between slides at 37 °C (full flow at 0.8 dynes/cm2, and half flow at 0.4 dynes/cm2) and room temperature were done through densitometry analysis at 28 h of growth using a flatbed scanner (the heterogeneity of the 37 °C slides prevents traditional microscope analysis); (C) Images of scanned biofilms after 28 h of growth are shown. Scale bars indicate 2 mm.

