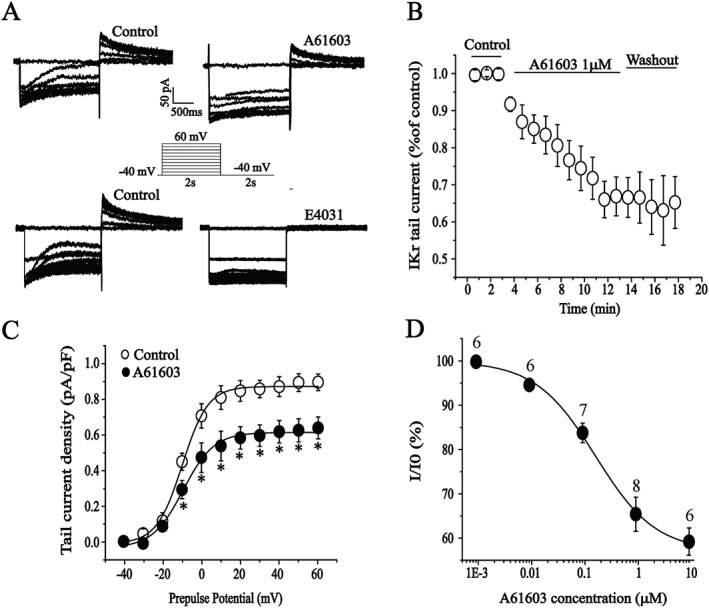
Figure 1.

Effects of the α1A‐adrenoreceptor agonist A61603 on IKr in isolated guinea pig ventricular cardiomyocytes. (A) Representative current traces recorded under pulse protocol shown in inset before (left) and after application of A61603 (1 μM) or E‐4031 (2 μM) (right). (B) The time course of the I Kr current reduction by A61603. n = 8. (C) The effect of A61603 on I Kr was quantitatively evaluated by measuring the percentage of decrease in the tail currents (n = 8). *P < 0.05, significantly different from control. (D) The concentration–response curve for the effect of A61603; the IC50 = 185 nM. The number above the data points represents the cell numbers assayed at each concentration. All of the cardiomyocytes were taken from five hearts.
