
Figure 4.
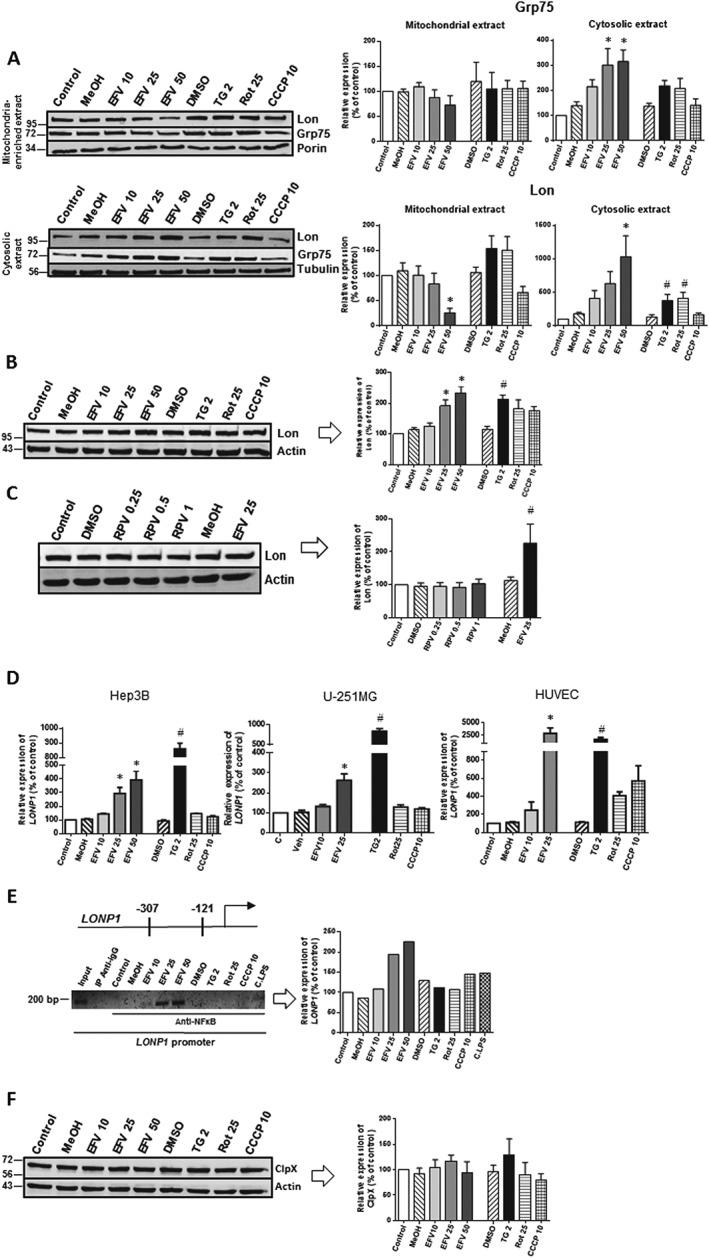
Analysis of the expression of Lon. Cells were treated for 24 h with increasing concentrations of efavirenz (EFV), vehicles (MeOH or DMSO), thapsigargin (TG) 2 μM, rotenone (Rot) 25 μM or CCCP 10 μM except for (C). (A) Representative Western blotting images and histograms expressing quantification of Grp75 and Lon in mitochondria‐enriched and cytosolic protein extracts (mean ± SEM, n = 6). (B) Western blotting analysis of Lon expression in whole‐cell protein extracts (mean ± SEM, n = 6). (C) Western blotting analysis of Lon expression in whole‐cell protein extracts obtained from Hep3B cells after 24 h treatment with rilpivirine (RPV; mean ± SEM, n = 5). (D) Quantitative RT‐PCR analysis (mean ± SEM) of LONP1 in Hep3B (n = 6 except for MeOH, rotenone and thapsigargin n = 7), U‐251MG (n = 6 except for efavirenz 10 n = 5, efavirenz 25 and thapsigargin n = 7) and HUVEC (n = 6). (E) Analysis of the recruitment of NF‐κB to the promoter of LONP1. Representative image of semiquantitative PCR after ChIP with anti‐NF‐κB; a non‐related antibody anti‐IgG and a sample of the input chromatin were used as controls. Aside from the aforementioned stimuli, cells were also treated with a pro‐inflammatory stimulus a cocktail of LPS, IFN‐γ and TNF‐α (C.LPS), a known activator of NF‐κB, which was employed as an additional control condition. (F) Study of ClpX expression by immunoblot in total cell extracts showing a representative image and a histogram of the quantified data (mean ± SEM, n = 6). Results are expressed as % of control (untreated cells considered 100%). Statistical analysis was performed by one‐way ANOVA (*P < 0.05 for efavirenz vs. MeOH and # P < 0.05 for thapsigargin, rotenone or CCCP vs. DMSO).