
Figure 5.
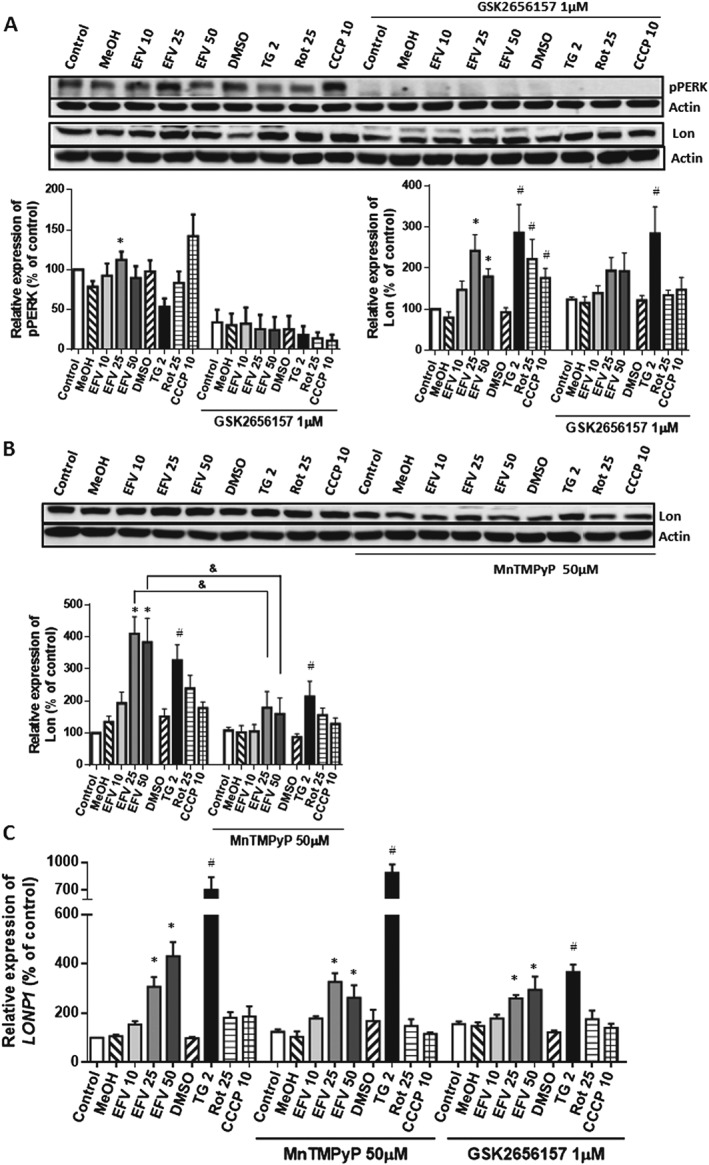
Analysis of the regulation of the expression of Lon. Cells were pretreated with the pPERK‐inhibitor GSK2656157 or the catalase/SOD mimetic MnTMPyP for 1 h and then treated for 24 h with increasing concentrations of efavirenz (EFV), vehicle, thapsigargin (TG) 2 μM, rotenone (Rot) 25 μM or CCCP 10 μM. (A) and (B) Western blotting analysis of PERK phosphorylation and Lon expression in whole‐cell extracts. Representative immunoblots and histograms of the quantified data are shown. (C) Quantitative RT‐PCR analysis of LONP1. Results (mean ± SEM) are expressed as % of control (untreated cells considered 100%); (A) left panel n = 7 for cells without pretreatment and n = 5 for pretreated cells; (B) n = 5 and (C) n = 9 for cells without pretreatment and n = 5 for pretreated cells. Statistical analysis was performed by one‐way ANOVA (*P < 0.05 for efavirenz vs. MeOH and # P < 0.05 for thapsigargin or rotenone vs. DMSO and & P < 0.05 for cells with vs. those without pretreatment).