
Figure 6.
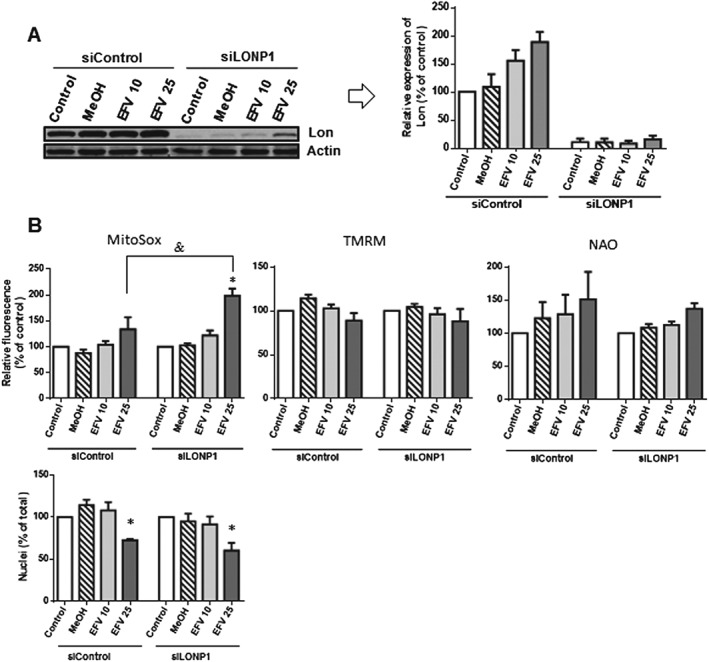
Analysis of the participation of Lon in the effect of efavirenz. Cells were transfected with siRNA Control or siLONP1 and treated for 24 h with efavirenz (EFV) or vehicle (MeOH). (A) Representative Western blotting image and histogram expressing quantification of Lon expression. (B) Histograms showing mean MitoSox (mitochondrial superoxide production), TMRM (mitochondrial membrane potential) and NAO fluorescence (mitochondrial mass – upper panel) and number of nuclei (visualized with Hoechst fluorescence) – lower panel. Data [mean ± SEM, n = 5 in (A) and in (B)‐upper panel, and n = 9 in (B)‐lower panel] are expressed as % of control (considered 100%). Statistical analysis was performed by one‐way ANOVA (*P < 0.05 for efavirenz vs. MeOH).