
Figure 7.
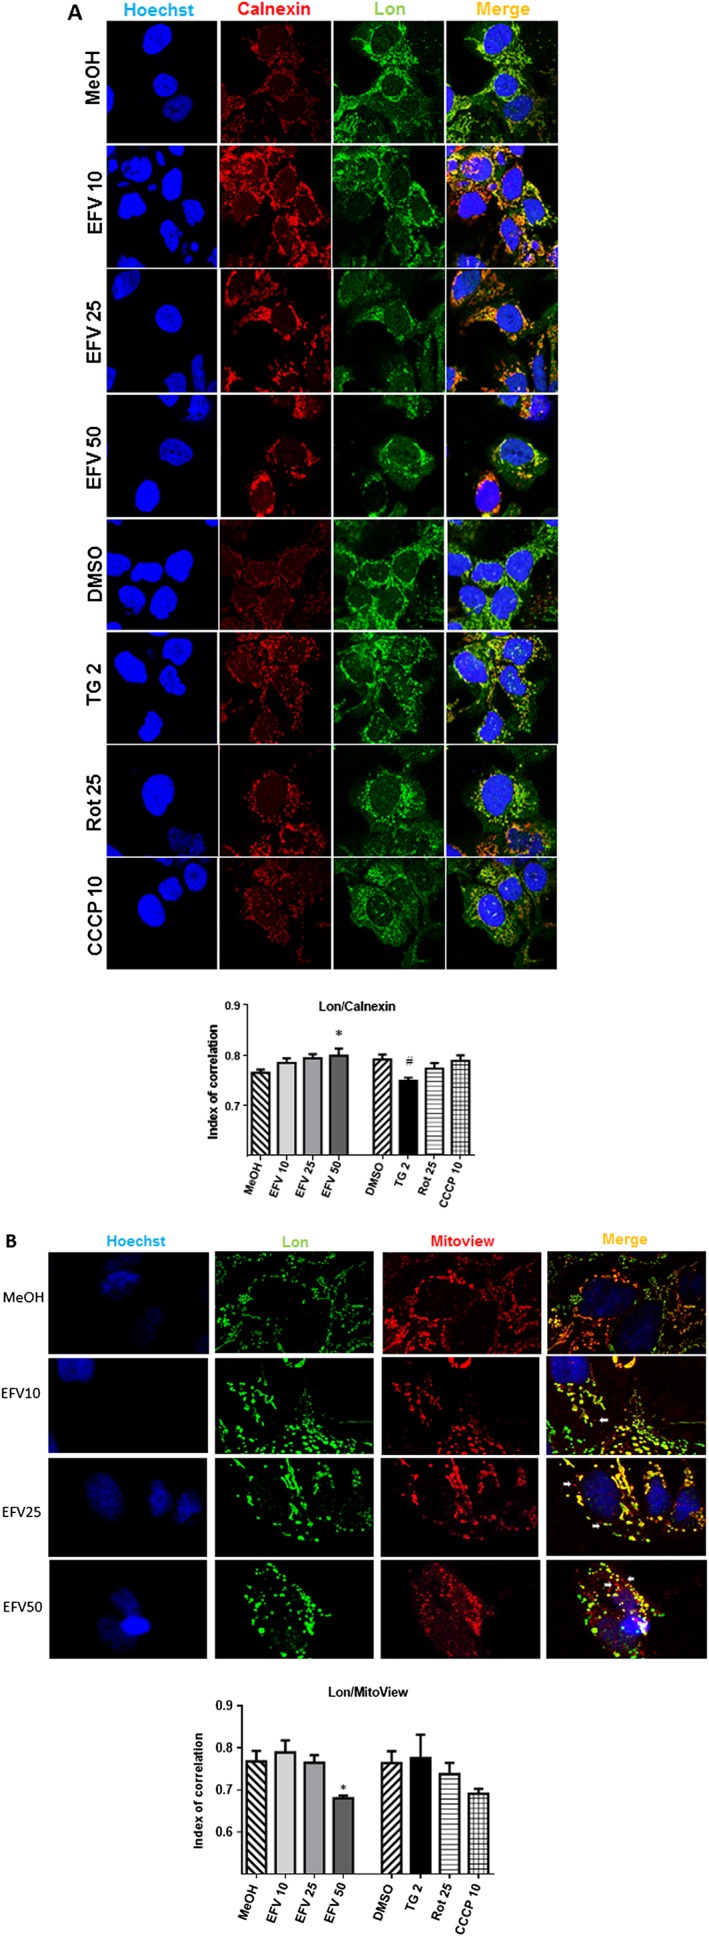
Analysis of the presence of Lon in the ER and mitochondria by confocal microscopy. Cells were treated for 24 h with increasing concentrations of efavirenz EFV), vehicle, thapsigargin (TG) 2 μM, rotenone (Rot) 25 μM or CCCP 10 μM and stained with (A) Hoechst 33342 (nuclei), anti‐calnexin (ER) antibody and anti‐Lon antibody or (B) Hoechst 33342 (nuclei), anti‐Lon antibody and Mitoview (MM fluorescent marker). Representative confocal microscopy images of 63× maginification with 3× optical zoom (A) or 3× optical + 1.5× digital zoom (B), and a histogram showing the index of correlation between Lon and ER (A) and Lon and mitochondria (B). White arrows show mitochondria that do not overlap with Lon. Data are shown as mean ± SEM, n = 5. Statistical analysis was performed by one‐way ANOVA (*P < 0.05 for efavirenz vs. MeOH and # P < 0.05 for thapsigargin, rotenone or CCCP vs. DMSO).