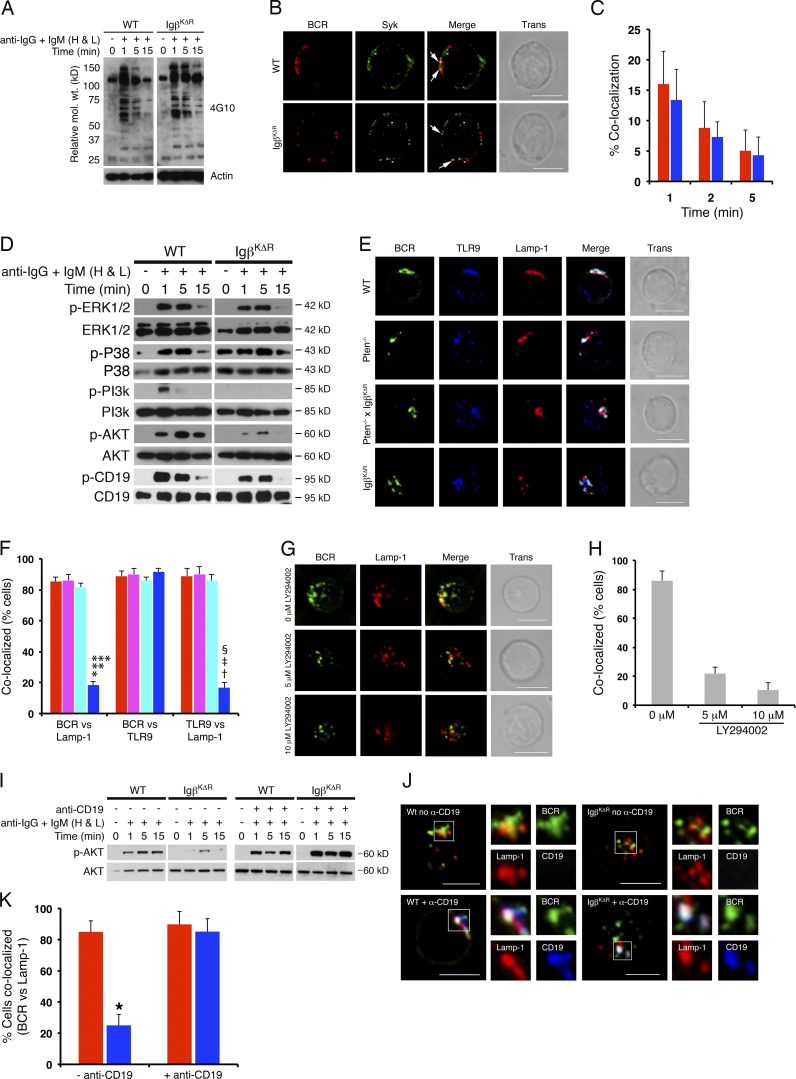
Figure 5.
PI3K-mediated entry into MIIC. (A) WT or IgβKΔR B splenocytes were stimulated with IgG- and IgM (H+L)-specific F(ab)2 antibodies for the indicated times, and total cell lysates were resolved by SDS-PAGE and immunoblotted with antiphosphotyrosine antibodies. Representative of three independent experiments. (B and C) WT or IgβKΔR splenocytes were stimulated with Texas red–labeled anti-IgG and -IgM (H+L) F(ab)2 antibodies for up to 5 min and then fixed, stained with antibodies to Syk, and visualized by confocal microscopy. Representative images provided in B. White arrows denote regions of colocalization. 1-min stimulation with percent colocalization (Manders’ coefficient) between WT (red) or IgβKΔR (blue) BCR and Syk as a function of time after stimulation (C; n = 3). (D) WT or IgβKΔR B splenocytes (106 cells per sample) were stimulated with IgG- and IgM (H+L)-specific F(ab)2 antibodies for the indicated times, and total cell lysates were resolved by SDS-PAGE and immunoblotted with the indicated antibodies. Each panel is representative of three independent experiments. (E and F) Splenocytes from WT (red), Pten−/− (purple), Pten−/−xIgβKΔR (light blue), and IgβKΔR (dark blue) mice were stimulated with FITC-conjugated IgG- and IgM (H+L)-specific F(ab)2 antibodies for 30 min in vitro and then fixed, stained with antibodies specific for Lamp-1 and TLR9, and visualized by confocal microscopy. Representative images (E) and quantitation of samples (n = 3). *, P = 0.0004; †, P = 0.0016 versus WT; **, P = 0.0004; ‡, P = 0.0023 versus Pten−/−; ***, P = 0.0002; §, P = 0.0014 versus Pten−/−xIgβKΔR (F). (G and H) WT splenocytes were treated with LY294002, stimulated, and visualized by confocal microscopy as above. (I) WT or IgβKΔR splenic B cells stimulated with IgG- and IgM (H+L)-specific F(ab)2 antibodies in the presence or absence of CD19 cross-linking for the indicated times. Total cell lysates blotted as indicated (n = 3). (J and K) Confocal microscopy of cells stimulated for 30 min as in I and stained with the indicated antibodies. Represented images (J) and quantitation across three experiments (K; *, P = 0.0014). Bars, 5 µm. Approximate molecular weight is shown. Error bars represent mean ± SD.

