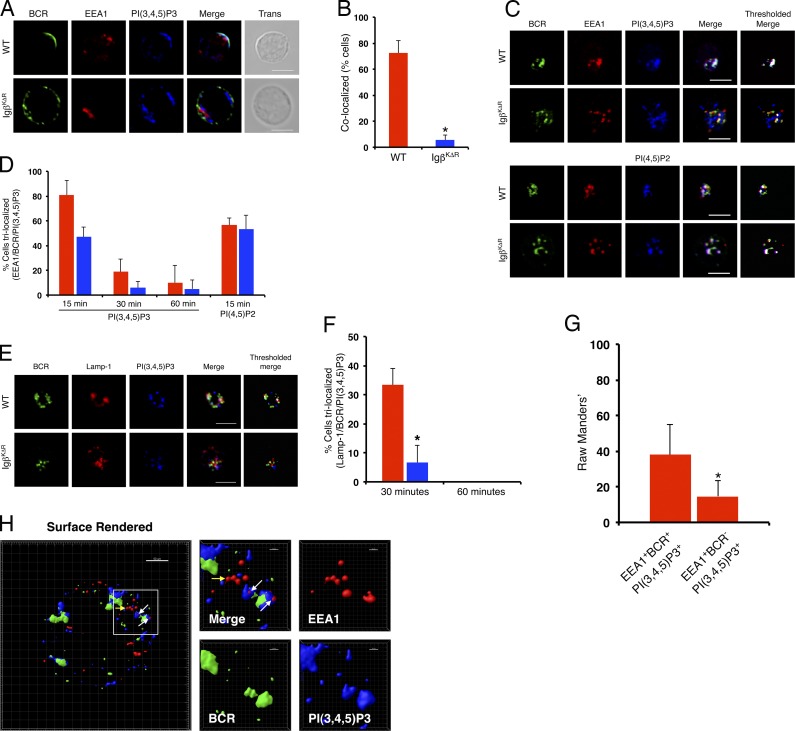
Figure 6.
Igβ ubiquitin–dependent endosomal PIP3. (A–F) Splenocytes from WT or IgβKΔR mice were stimulated with FITC-conjugated IgG- and IgM (H+L)-specific F(ab)2 antibodies for the indicated times, then fixed, stained with antibodies specific for Lamp-1, EEA1, and PIP3, and visualized by confocal microscopy. Representative images from 2 min (A), and quantitation of samples (n = 3); *, P = 2.6 × 10⁻⁵ (B). Representative images from 15 min of cells with EEA1 (C), and quantitations (n = 3; *, P ≤ 0.05; D). Representative images of cells treated as in C stained with Lamp-1 (E) with quantitations in F (n = 3; *, P = 0.0048). Quantitation of BCR+ and BCR−EEA1+ early endosomes containing PIP3 (n = 3). *, P > 0.0001 (G). (H) Splenocytes from WT mice were stimulated as above with Alexa Fluor 488–conjugated IgG- and IgM (H+L)-specific F(ab)2 antibodies for 15 min, then fixed and stained with antibodies for EEA1 and PIP3, and then visualized by superresolution confocal microscopy. White arrows indicate trilocalization of BCR+EEA1+PIP3+ vesicles, and the yellow arrow indicates BCR−EEA1+PIP3 vesicles. Bars, 5 µm. Error bars represent mean ± SD.

