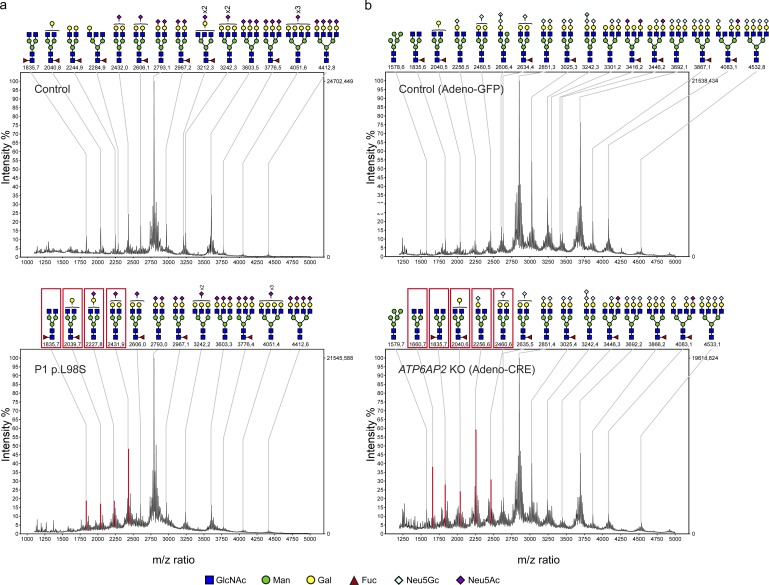
Figure 3.
Hypoglycosylation of serum proteins in patient and mouse samples. (a) N-linked glycans of serum from a healthy individual (top) and from P1 with the L98S mutation in ATP6AP2 (bottom) were analyzed by MALDI-TOF MS. (b) Representative MALDI-TOF MS profiles of adeno-GFP- (n = 7) and adeno-CRE- (n = 5) injected mice (complete data can be found in Fig. S4). Red boxes and peaks in the lower panels of a and b indicate the increase of biantennary glycans (compared with most extensively branched N-glycans in the control), which also contain less undersialylated structures.

