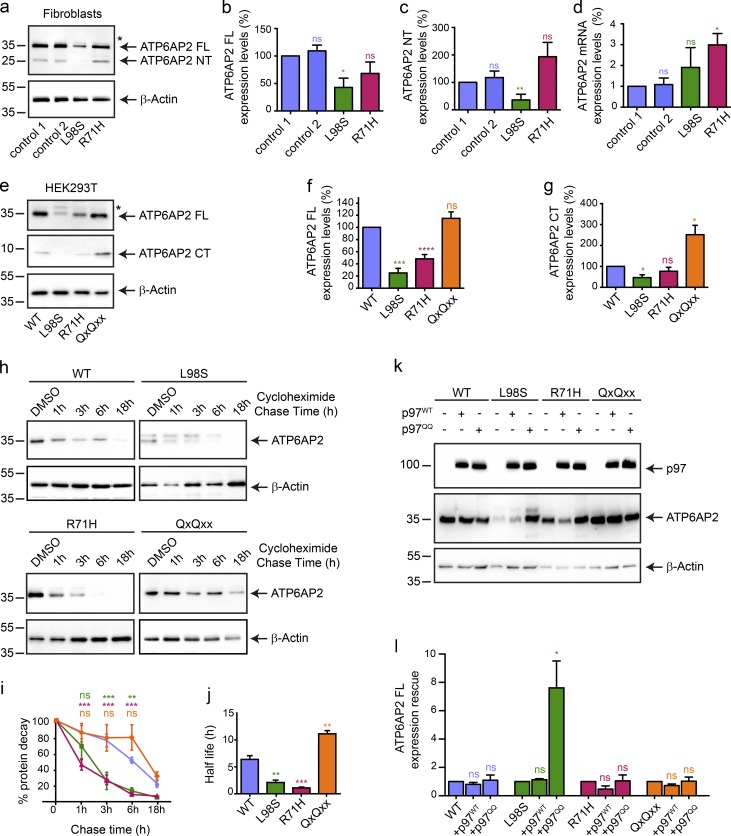
Figure 4.
ATP6AP2 mutants p.L98S and p.R71H are degraded via ERAD. (a) Endogenous levels of ATP6AP2 FL and NT in control and patient fibroblasts using anti-ATP6AP2-NT. The asterisk * indicates glycosylated form of ATP6AP2L98S. (b and c) Expression levels of ATP6AP2 FL and NT relative to those of β-actin were calculated. All data are mean ± SEM of three independent experiments. ns, not significant; *, P < 0.05; **, P < 0.01. The statistical significance was determined by an unpaired Student’s t test. (d) ATP6AP2 mRNA quantification in control and patient fibroblasts. All data are mean ± SEM of three independent experiments. ns, not significant; *, P < 0.05. The statistical significance was determined by an unpaired Student’s t test. (e) Steady-state levels of overexpressed ATP6AP2WT-HA, ATP6AP2L98S-HA, ATP6AP2R71H-HA, and ATP6AP2QxQxx-HA at 48 h after transfection in HEK293T cells. Anti-HA reveals FL and CT. The asterisk indicates glycosylated form of ATP6AP2L98S. (f and g) Expression levels of ATP6AP2 FL and CT relative to those of β-actin were calculated. All data are mean ± SEM of five independent experiments. ns, not significant; *, P < 0.05; ***, P < 0.001; ****, P < 0.0001. The statistical significance was determined by an unpaired Student’s t test. (h–j) Turnover of ATP6AP2 WT, L98S, R71H, and QxQxx was determined by cycloheximide (100 µM) chase experiments. The chase started 24 h after transfection and was allowed for the indicated time. The percentage of the protein decay was graphically reported (i), and the difference of the in cellulo half-life between the WT, L98S, R71H, and QxQxx was analyzed in j. Blots are representative of four individual experiments. All data are mean ± SEM of four independent experiments. ns, not significant; **, P < 0.01; ***, P < 0.001. The statistical significance was determined by a regular two-way ANOVA followed by a Bonferroni multiple comparisons test in i and an unpaired Student’s t test in j. (k) HEK293T cells were transiently cotransfected with the CT-tagged construct ATP6AP2 WT, L98S, R71H, and QxQxx and p97-WT-His or p97-QQ-His. Samples were analyzed with anti-HA and anti-His antibodies. (l) Expression levels of ATP6AP2 FL in the presence of p97WT or p97QQ relative to those of β-actin were calculated. All data are mean ± SEM of three independent experiments. ns, not significant; *, P < 0.05. The statistical significance was determined by an unpaired Student’s t test. Molecular mass is indicated in kilodaltons.

