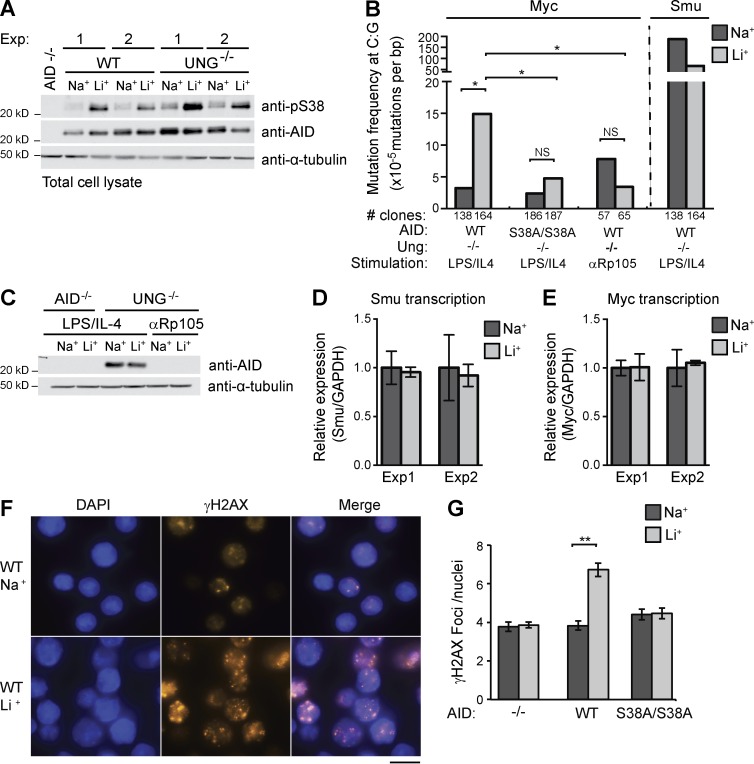
Figure 5.
Phosphorylation promotes differential targeting of AID mutation activity. (A) Anti-pS38, anti-AID, and anti–α-tubulin immunoblot of cell lysates from AID−/−, WT, or Ung−/− B cells activated for 72 h and treated with 10 mM LiCl (Li+) or control NaCl (Na+) for 12 h. Two independent experiments displayed. (B) Mutation frequency at C:G bases in Myc or Igh Smu. B cells from Ung−/− or Ung−/−/AIDS38A/S38A double-mutant mice were stimulated as indicated. Graph is summary of n = 5 independent experiments. Number of clones sequenced indicated. P-values (*, P < 0.05) were determined by a two-tailed t test assuming unequal variance (Myc: WT Na+ vs. Li+ and AIDS38A Na+ vs. Li+, both not significant [NS], P > 0.4, Smu: Na+ vs. Li+, P = 0.07). (C) Anti-AID and anti–α-tubulin immunoblot of lysates from AID−/− or UNG−/− B cells activated with either LPS/IL-4 or anti-Rp105. Representative of n = 2 experiments. (D and E) Igh Smu germline (D) and Myc (E) transcript level analysis. Levels of each transcript from treated B cells were analyzed by quantitative RT-PCR and quantified relative to Gapdh transcript levels. Control NaCl sample transcript levels arbitrarily set to 1; n = 2 experiments are displayed. Error bars are SE. (F) Representative image of WT B cell nuclei stained with DAPI (blue) and anti-γH2AX (red). Bar, 10 µm. (G) Mean number of foci in nuclei positive for γH2AX staining. Data representative of n = 3 experiments (error bars, SEM); **, P < 0.001; t test.

