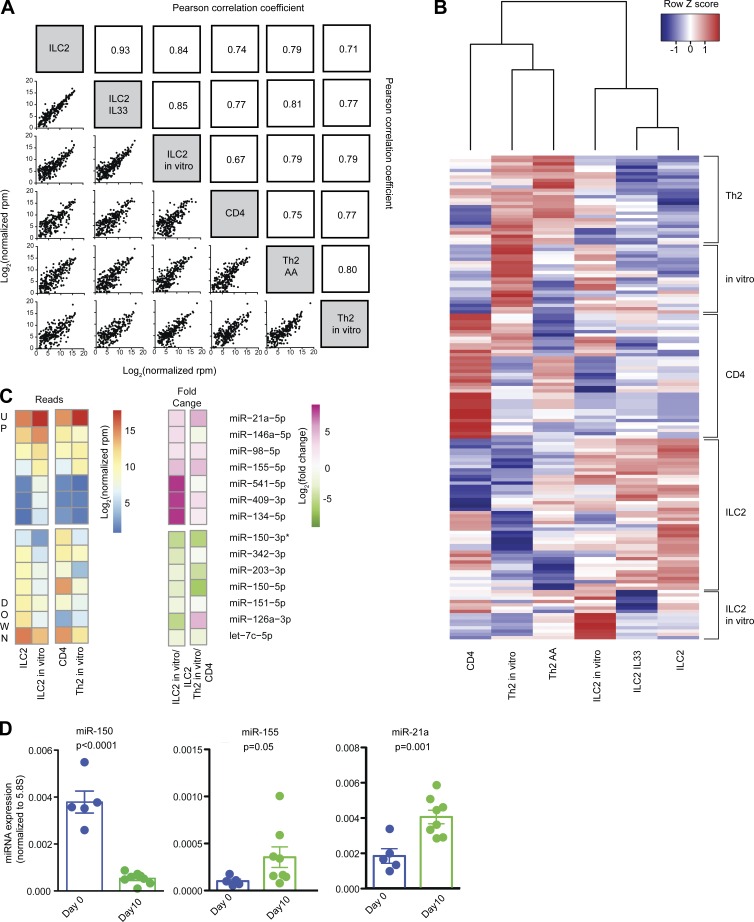
Figure 1.
Small RNA sequencing expression analysis of miRNAs in ILC2s and T cells. (A) Pearson correlation coefficients for global miRNA expression profiles among all samples. Sample groups include ILC2s isolated from naive mouse lung (ILC2), ILC2s isolated from mouse lung after IL-33 treatment (ILC2 IL33), ILC2 cultured in vitro for 10 d (ILC2 in vitro), naive CD4 T cells (CD4), TH2 cells isolated from BAL of mice with AAs (TH2 AA), and TH2 cells polarized in vitro (TH2 in vitro). (B) Unsupervised hierarchical clustering of all DESeq2 differentially expressed miRNAs. A list of individual miRNAs in each subgroup is included in Table S2. (C) Heat map of log2 normalized read counts and fold changes of miRNAs significantly (adjusted P < 0.01) up- or down-regulated in ILC2s after culture in vitro with IL-33, TSLP, and IL-7. Values for naive CD4 T cells and T cells after 5 d of TH2 polarizing culture are also provided for comparison. (D) Quantitative PCR confirmation of RNA sequencing data for the indicated miRNAs. Bars represent mean ± SEM. P-values were calculated with Student’s t test.

