Figure 2.
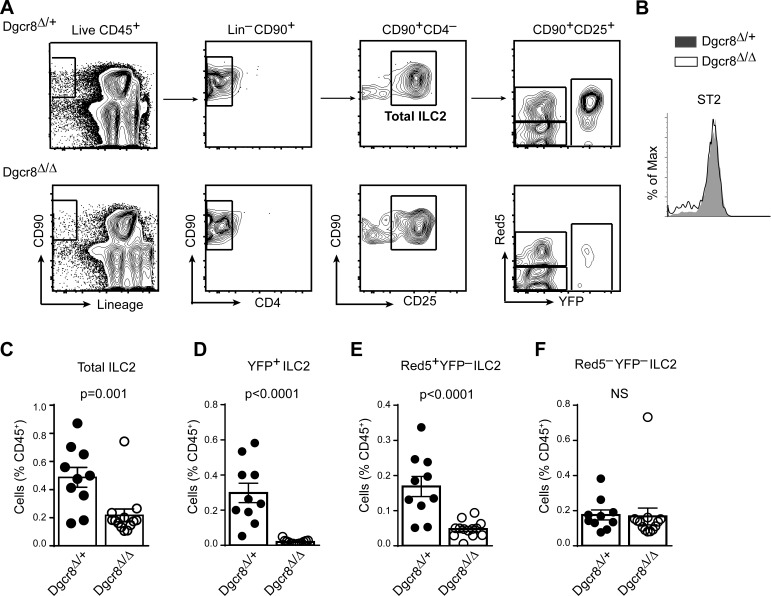
Severe reduction of lung ILC2s in Red5 Dgcr8Δ/Δ mice. (A) Contour plots depict the gating strategy for lung ILC2s in Dgcr8Δ/+ and Dgcr8Δ/Δ mice. Total ILC2s are identified as live CD45+CD90+lin–CD4–CD25+ cells. Among total ILC2s, tdTomato (Red5) fluorescence indicates Cre expression, and YFP expressed from the R26-YFP reporter indicates Cre activity. (B) Flow cytometric analysis of ST2 median fluorescence intensity (MFI) in the total ILC2s of Dgcr8Δ/+ and Dgcr8Δ/Δ lung. (C–F) Flow cytometric quantification of total ILC2s (C), YFP+ ILC2s (D), Red5+ YFP–ILC2s (E), and Red5– YFP–ILC2s (F) in the lung of Dgcr8Δ/+ and Dgcr8Δ/Δ mice. Bar graphs show ILC2 frequency as percentage of live CD45+ cells (mean ± SEM). Each data point represents an individual mouse. Data were pooled from two independent experiments each with five to seven mice per group. P-values were calculated with Student’s t test.

