Figure 3.
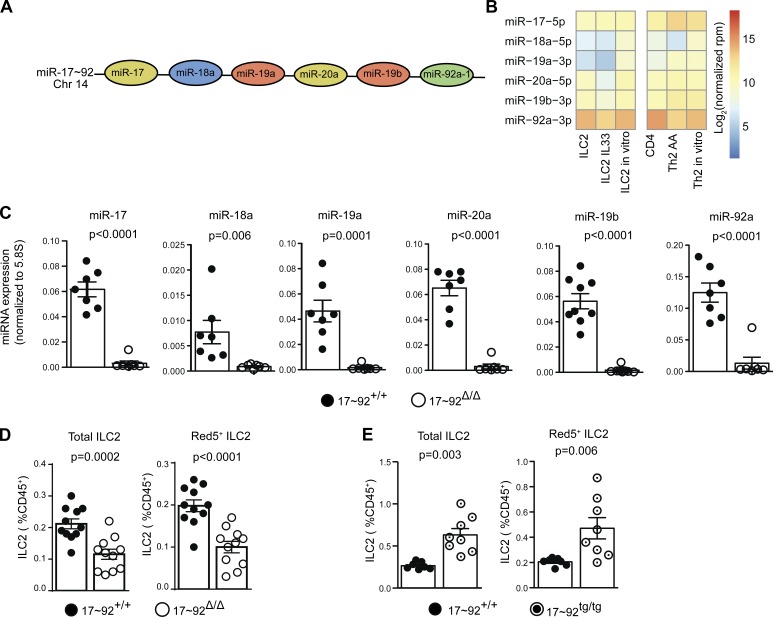
miR-17∼92 cluster expression and requirement in lung ILC2s. (A) Schematic of the miR-17∼92 cluster miRNAs and their chromosomal positions. Colors indicate miRNAs families. (B) Heat map of log2 normalized read counts of miR-17∼92 cluster miRNAs in the indicated cell types (see Fig. 1 legend). (C) Quantitative PCR quantification of the indicated miRNAs in 10-d-cultured 17∼92Δ/Δ and 17∼92+/+ ILC2s. Symbols indicate individual cultures seeded with cells from a pool of two to three mice each. Data were pooled from three independent experiments. (D and E) Flow cytometric quantification of total lung ILC2 and Red5+ ILC2 frequency (see Fig. 2 A legend) in 17∼92Δ/Δ (D) and 17∼92tg/tg (E) mice compared with matched 17∼92+/+ controls. Each ILC2 culture was started with 10,000 (B) or 3,500 (C) ILC2s sorted from individual mouse or pools of two to six mice and cultured with IL-33, TSLP, and IL-7 for 10 d. Each data point represents the ILC2 frequency expressed as percentage of live CD45+ cells in an individual mouse. Data were pooled from two independent experiments. Bars represent mean ± SEM. P-values were calculated with Student’s t test.

