Figure 5.
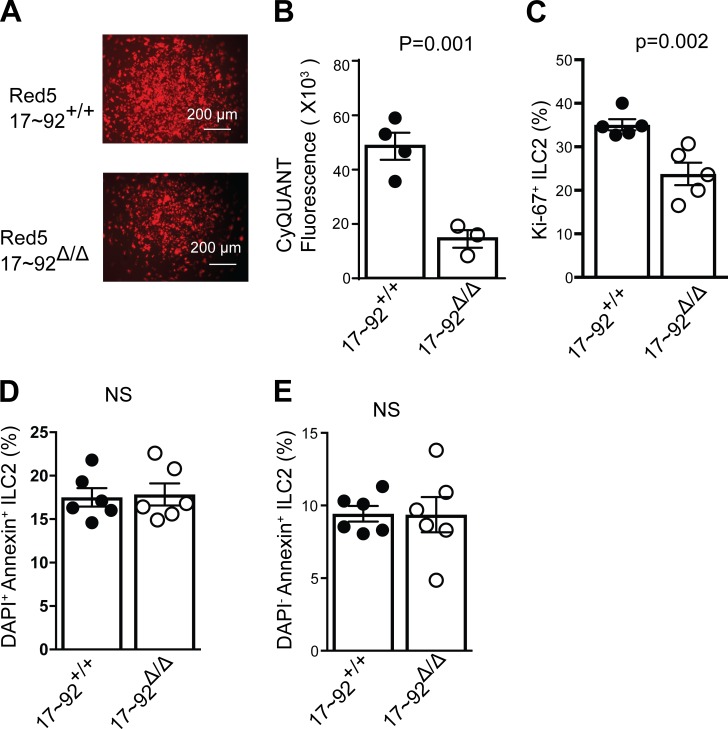
The miR-17∼92 cluster promotes ILC2s proliferation. (A) Microscopic view of tdTomato fluorescence in Red5+ ILC2s. Bars, 200 µm. (B) CyQUANT NF cell proliferation assay fluorescent quantification of 17∼92Δ/Δ and 17∼92+/+ ILC2s after culture for 4 d. (C) Quantification of Ki67+ 17∼92Δ/Δ and 17∼92+/+ ILC2s frequencies after culture for 3 d. (D and E) Apoptosis in 17∼92Δ/Δ and 17∼92+/+ ILC2s was assessed using Annexin V and DAPI staining on day 4 of culture. Bar graphs show the percentage of dead apoptotic ILC2s (DAPI+ Annexin+; D) and live apoptotic ILC2s (DAPI− Annexin−; E). NS, not significant. Data in A, B, D, and E are representative of at least 20, 4, and 2 independent experiments, respectively. Bars represent mean ± SEM. P-values were calculated with Student’s t test (B–E).

