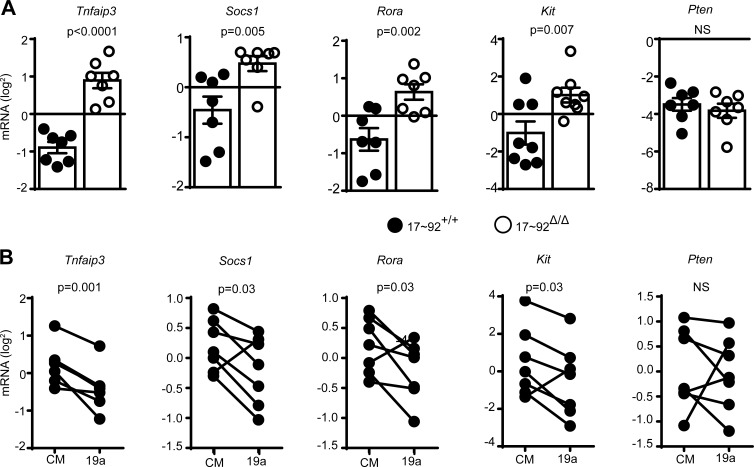
Figure 8.
miR-19 regulates target gene expression in ILC2s. (A) Quantitative PCR (qPCR) quantification of the indicated candidate miR-19a target mRNAs in 10-d-cultured 17∼92+/+ and 17∼92Δ/Δ ILC2s. (B) qPCR quantification of mRNAs in 17∼92Δ/Δ ILC2s transfected with control mimic (CM) or miR-19a mimic (19a). Data are normalized to Gapdh mRNA. Each culture was started with 3,500 (A) or 10,000 (B) ILCs, sorted from pools of two to six mice. Data are pooled from three independent experiments (A and B). Bars represent mean ± SEM. P-values were calculated with Student’s t test (A) or paired Student’s t test (B).

