Figure 8.
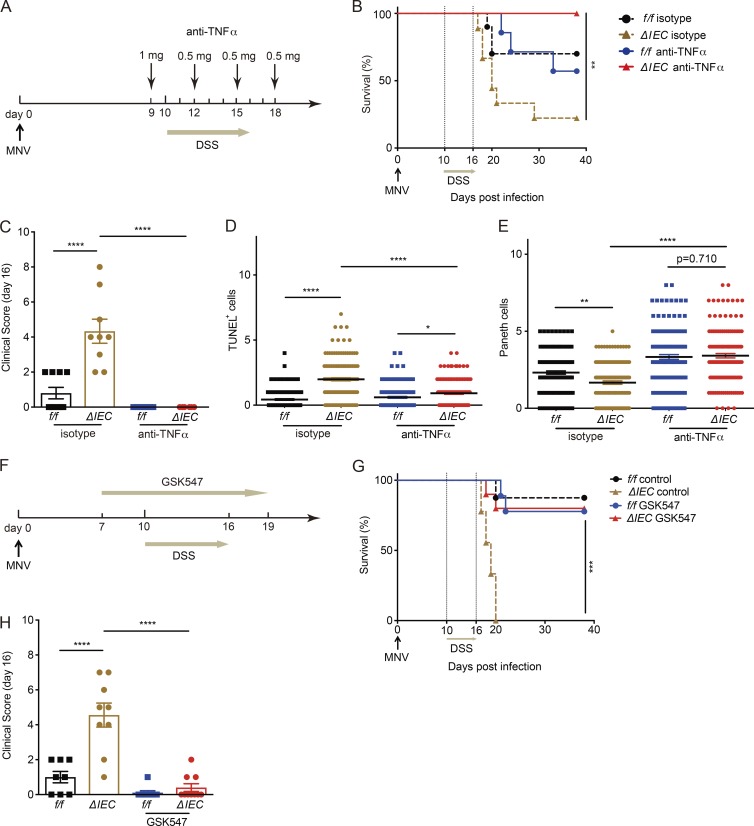
TNFα and RIPK1 inhibition ameliorates disease in ATG16L1-deficient mice. (A) Schematic representation of anti-TNFα treatment in MNV+DSS model. (B and C) Survival of Atg16L1f/f (f/f) and Atg16L1ΔIEC (ΔIEC) mice treated with anti-TNFα or isotype control antibodies were monitored for survival (B) and clinical disease score (C) on day 16. n = 7 (f/f, isotype), 9 (ΔIEC, isotype), 7 (f/f, anti-TNF), and 10 (ΔIEC, anti-TNF). (D and E) Number of TUNEL+ (D) and Paneth (E) cells per crypt on day 15 in mice treated ± anti-TNFα. At least 50 crypts were quantified from three mice per group. (F) Schematic representation of GSK547 treatment in MNV+DSS model. (G and H) Atg16L1f/f and Atg16L1ΔIEC mice treated with either GSK547 or control chow were monitored for survival (G) and clinical disease score on day 16 (H). n = 8 (f/f, control), 9 (ΔIEC, control), 9 (f/f, GSK547), and 10 (ΔIEC, GSK547). Data points in C and H represent individual mice, and data points in D and E represent individual crypts. Bars represent mean ± SEM, and at least two independent experiments were performed. *, P < 0.05; **, P < 0.01; ***, P < 0.001; ****, P < 0.0001 by Mantel-Cox in B and G and one-way ANOVA and Tukey’s test in C–E and H.

