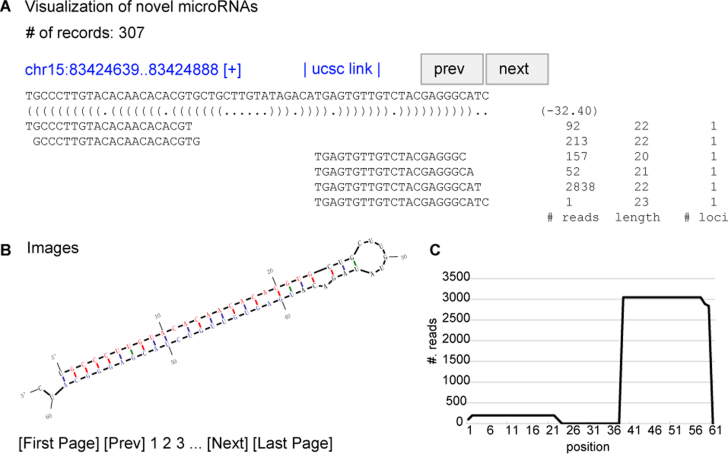
Figure 3.
A schematic graphic output from miRvial. miRvial provides graphic output to assist visual inspection and selection of genuine miRNAs. Shown is an example of a miRNA detected by miRvial. (A) The upper panel gives the number of candidate miRNAs miRvial reported; one in this case shown. The panel shows the unique genomic locus of the miRNA, along with the predicted RNA secondary structure represented in parentheses, and the folding energy in a negative value. The lines below show the aligned sequencing reads, followed by the number of reads (# reads), the length of the unique read (length), and the number of mappable loci of the unique read (#. loci). (B) The lower-left plot shows the hairpin structure, where putative mature miRNAs are highlighted in color (blue from 5p-arm and red from 3p-arm). (C) The lower-right plot shows the distribution of reads in the predicted precursor sequence.

