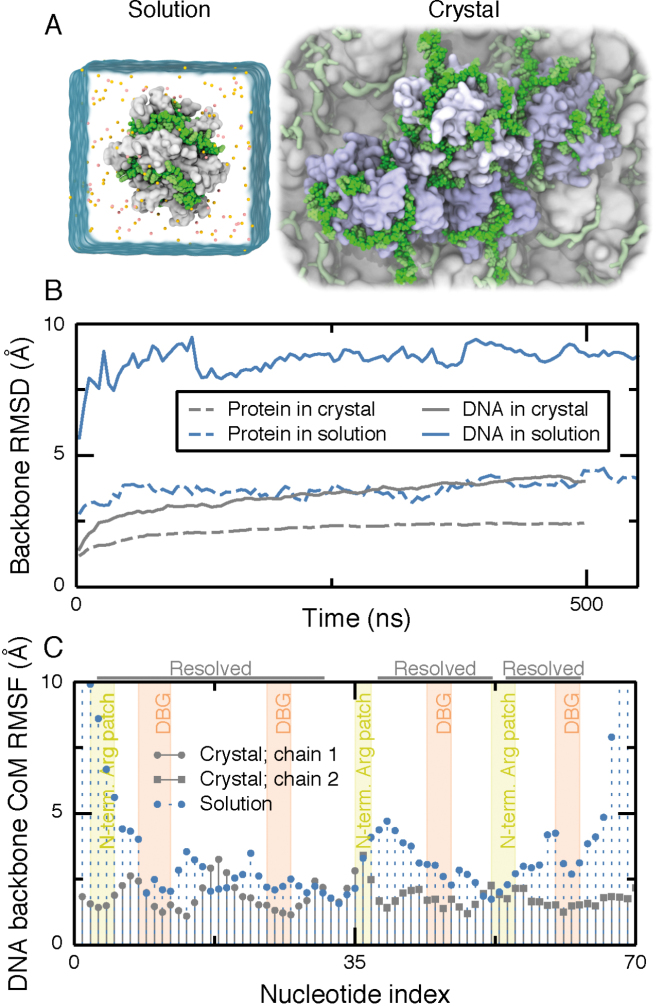
Figure 2.
Mobility of ssDNA on SSB surface in solution and crystal structure environments. (A) Simulation unit cells for solution (left) and crystal (right) environments. The simulation unit cell for the solution environment contains one SSB tetramer (white molecular surface) wrapped with dC70 (green vdW spheres). Ions are depicted as orange and yellow spheres and water is depicted as a semi-transparent surface. The unit cell for the crystal environment contains four SSB oligomers (light blue) and eight 35-nt ssDNA fragments (green) submerged in solvent. One crystallographic unit cell is highlighted using green vdW spheres for DNA and molecular surfaces for the SSB proteins. Several copies of the crystallographic unit cells are depicted in the background using a less detailed molecular surface representation. Water and ions are not shown. (B) Root-mean squared deviation (RMSD) of the DNA and protein backbone from their crystallographic coordinates during simulations in the crystal (gray; 100 mM KCl) and solution (blue; 160 mM KCl) environments. For DNA, only the nucleotides resolved in the crystal structure were used for the calculation. For the crystal structure system, the RMSD values were averaged over the four copies of the SSB–ssDNA complex. (C) Root-mean squared fluctuations (RMSF) of the center of mass (CoM) of the backbone of each nucleotide during 500 ns of simulation. The annotation at the top of the figure indicates the nucleotides resolved in the crystal structure. Each resolved nucleotide in the crystal structure had a corresponding nucleotide in the model of SSB65. The tinted background indicates nucleotides interacting with the N-terminal arginine-rich patch (yellow) and the DBGs (orange). Motion of nucleotides through these regions was seen to be extremely rare and very small in magnitude, so ascribing the regions to ranges of nucleotide index is a good approximation.

