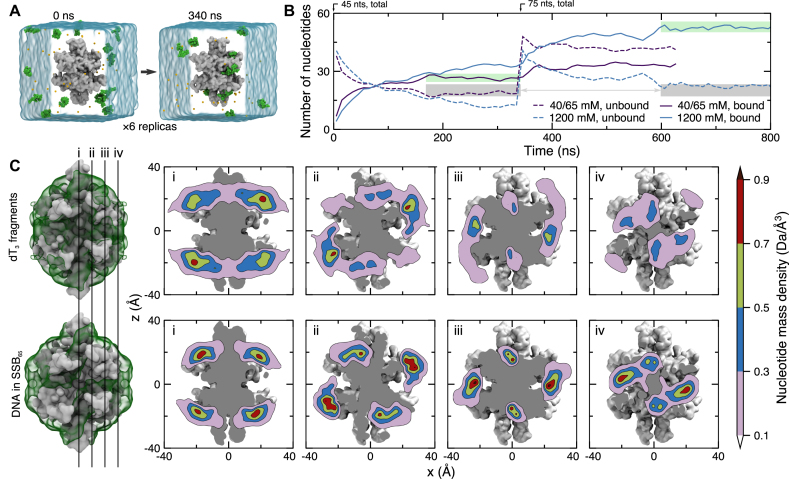
Figure 4.
Spontaneous association of ssDNA with SSB. (A) Microscopic configuration of one of six simulation systems at the beginning (left) and after 340 ns (right) of equilibration simulation. Each system contains 15 dT3 fragments (green vdW spheres), one SSB protein truncated after amino acid 112 (gray molecular surface), water (semitransparent blue surface) and ions (small spheres). Initially, DNA fragments were placed at random positions and orientations such that no fragment possessed a 4-Å contact with the protein. During the equilibration simulations, the α carbon atoms of amino acids forming β sheets and α helices were harmonically restrained about their initial coordinates (ksp = 1 kcal/mol) while DNA fragments spontaneously bind to and dissociate from the SSB surface. (B) Ion concentration-dependent binding of ssDNA fragments to SSB. Purple and blue lines indicate data for the systems containing 40 and 1200 mM electrolyte, respectively. For each system, six simulations were performed in parallel starting with fifteen dT3 fragments randomly placed around SSB; no DNA fragment was initially in contact with SSB. After 340 ns, another ten dT3 fragments plus neutralizing counterions were added to the simulation systems. This brought the bulk-like counterion concentration up to 65 mM for the 40 mM system. The solid/dashed lines indicate the average (over the six simulation systems) number of DNA nucleotides bound to/unbound from SSB. The gray regions highlight similar steady-state concentrations of free (not bound to SSB) nucleotides in the 40 and 1200 mM NaCl systems containing 45 and 75 ssDNA fragments, respectively. The green regions emphasize the dependence of ssDNA binding on ion concentration. (C) Equilibrium density of DNA nucleotides observed in MD simulations of spontaneous binding of the DNA fragments (top row) and in the simulations of the SSB65 complex in 160 mM KCl (bottom row). The mass density of DNA atoms was obtained using the volmap plugin of VMD with a 1-Å resolution, averaged over all equivalent simulation trajectories (except the first 100 ns), and the symmetry axes of the homotetramer. The left-most column depicts the SSB as a gray molecular surface and the DNA mass density isosurface as a semi-transparent green surface. The surface isovalue was taken to be one tenth of the peak value in each density. The four vertical lines labeled i–iv depict the locations of the DNA mass density tomograms shown to the right. From left to right, the slices move away from the center of the SSB.

