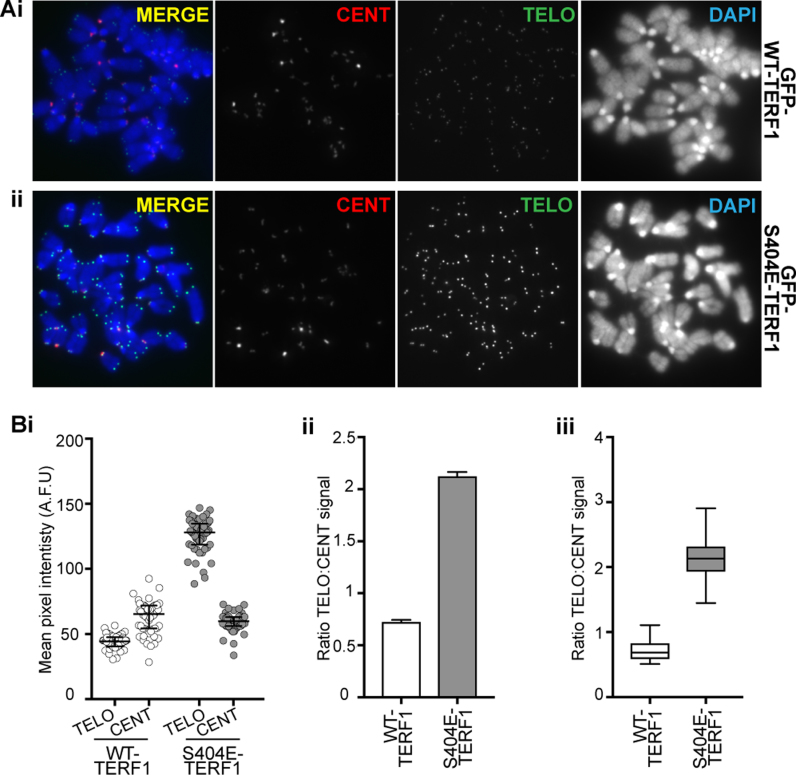
Figure 6.
Long-term expression of S404E-TERF1 results in telomere lengthening. (A) Representative images of GFP-WT-TERF1 (i) and GFP-S404E-TERF1 cells (ii). Telomere length in these cells was analysed using a TEL-FISH quantitative protocol using DNA probes specific to telomere (green) and centromere (red) sequences. TEL-FISH signals in the GFP-S404E GFP-S404A-TERF1 and GFP-S404E-TERF1 cells were increased in intensity when compared to those in GFP-WT-TERF1 cells. (B) Fluorescence quantitation showed that telomeres in GFP-TERF1-S404E were longer than those in GFP-WT-TERF1 cells. (i) The scatter plot shows the mean pixel intensities of TEL-FISH centromere satellite and signals for all metaphase spreads, respectively. The centromere FISH signals between the WT and mutant GFP-TERF1 cell lines were similar in levels. TEL-FISH signals were normalized against centromere-FISH signals, as shown as column graphs (ii) and box and whiskers plots (iii). TEL-FISH signals in GFP-S404E-TERF1 cells were increased by almost three times than those in GFP-WT-TERF1 cells, indicating an increase in telomere length. The error bars in (Bi) represent standard error of the mean. (P = 0.0001, > 50 spreads from three biological replicates were assessed per cell line). Box and whiskers plot shown in (Bii) represent Q1, Q2 and Q3, with the maximum and minimum values plotted.

